Saturday, 29 June 2019

Learn Microsoft Business intelligence step by step – Day 2

What we have learned last time?

In Day 1 we have learned following things

Day 1 to Day 2
  1. What is Data warehouse?
  2. How it is different From Traditional database?
  3. What is Business Intelligence?
  4. What is the purpose of SSIS, SSAS and SSRS?
  5. How create a simple ETL package using SSIS?

Agenda for Day 2

·     How to design Data Warehouse?
o    Now the question is how to design DW?
o    How Dimensions and Facts are different from traditional tables?
o    Data warehouse design techniques.
o    Advantages and Disadvantages of Star schema and snow flake design.
·     Lab 2, 3, 4 and 5- Explore Control Flow.
o    Lab 2 - Execute SQL Task.
o    Lab 3 – Backup database Task.
o    Lab 4 – Script Task and Variables.
Snowflake

How to design Data Warehouse?

We already have a basic knowledge about Data Warehouse by now. It’s typically a database holding data in a denormalized manner. Data from multiple places (multiple data sources) are collected and stored into DW (Data warehouse). SSIS (SQL server integration services) is the Microsoft’s business intelligence platform for performing this task.

Now the question is how to design DW?

In order to design data warehouse you have to ask yourself two questions.
  1. What you want to calculate?
    Answer may be – Total profit, Total spend etc.
  2. What will be your filters? OR What are the basis for your calculation?
    Answer may be – Location, Time, Customer etc. because your target is to find out
    1. What is the total sale in particular location? Once you get the value you can take appropriate actions like, you can run some campaign or advertisements at one with least sale.
    2. In last 5 years which was the best year for business or in short in which year maximum sales happened?
    3. Which customer did purchased the maximum goods.

DW Basically contains two main types of tables. One is a fact table which contain measurement of a business process and other is a dimension table which will be used for filtering, grouping and sorting of our data. In the above example,
  • Location, Time (one which will hold years) and customer will become your Dimensions
  • Sale become your Facts.
Note: Facts and Dimensions are simply tables.
Designing Data Warehouse is all about,
  • understanding the Dimensions and Facts in the business
  • and creating appropriate tables.

How Dimensions and Facts are different from traditional tables

In order to understand this, let’s have an example. Look at the database diagram of tradition Normalized database.
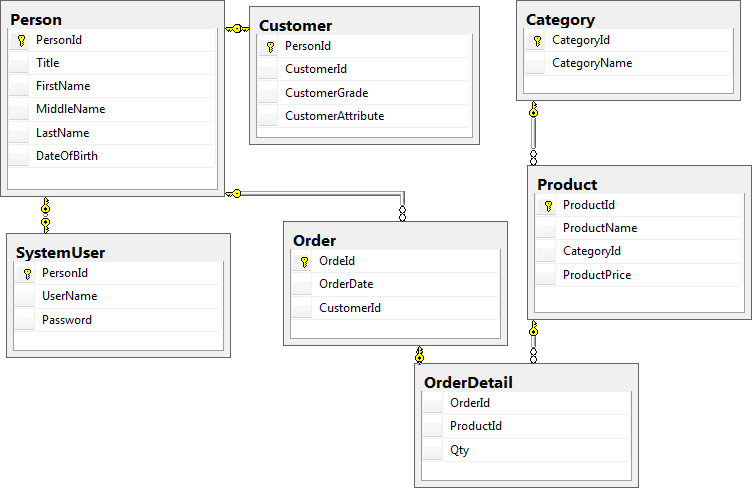
Traditional Database
Now let see how to make DW from above one
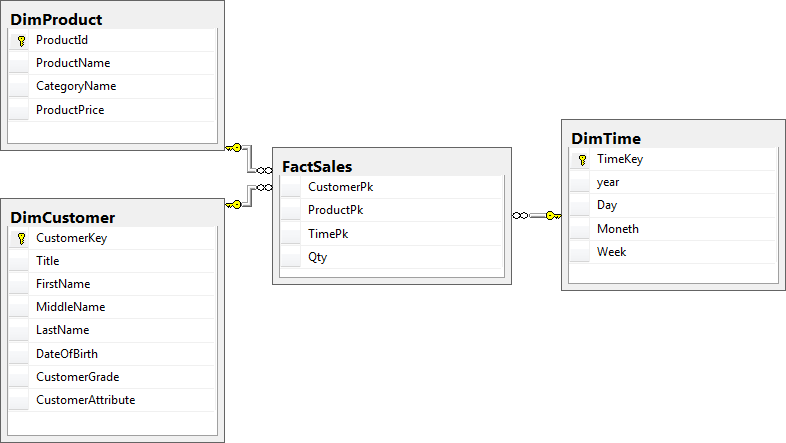
Data Warehouse
As you can see,
  • Traditional tables are converted into denormalized Dimensions.
  • Fact table created contains only 2 things
    • Numbers which can be used for calculation
    • References for dimension table keys.

Data warehouse design techniques

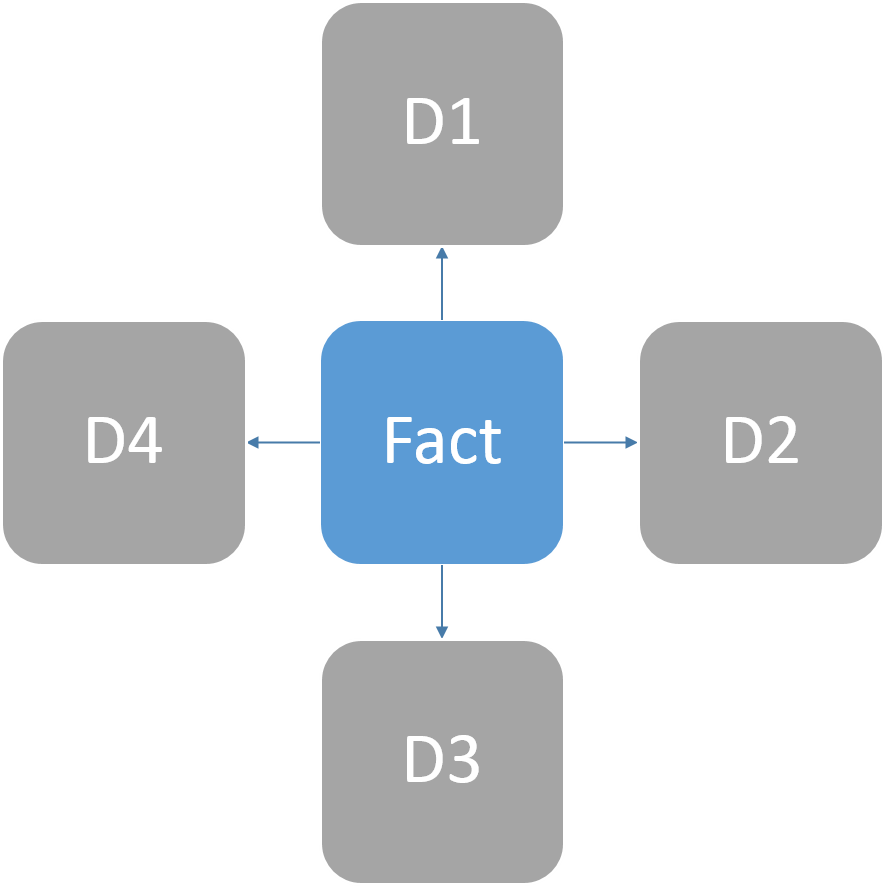
Above technique where Fact table references Dimension tables and Dimension tables
are completely denormalized leads to a database diagram which looks like star and hence
 called as Star schema design.
In Star schema design, one fact table will be surrounded by many dimension tables.
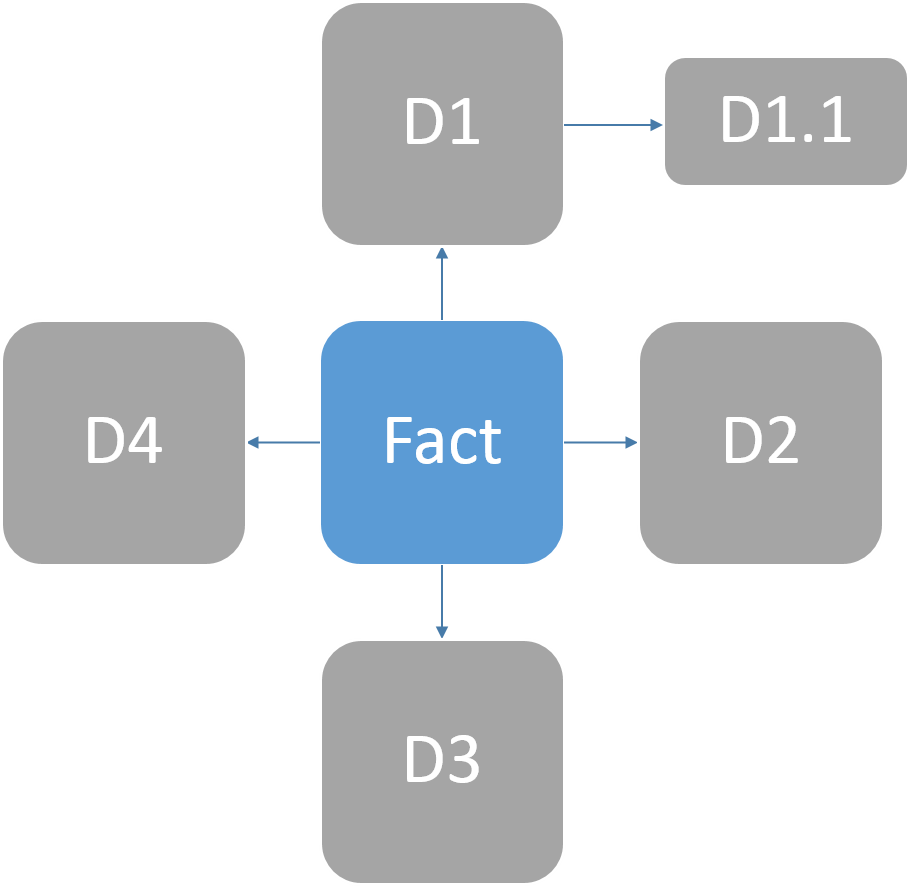
StarThere is one more way of designing data ware houses.
It’s called Snowflake design. In this normalization of some dimension
tables is considered to some extent.

Advantages and Disadvantages of Star schema and Snowflake design

  • Star schema design we get more performance because dimensions are denormalized. In Snowflake performance will be comparatively less compared to star flake.
  • In Star schema data management will be difficult compare to snowflake because data redundancy is more.
  • In Star schema queries will be simpler because joins will be comparatively less.
Conclusion – If data integrity and data redundancy is big concern snowflake is best. If performance is the major concern star schema fits best.

Lab 2, 3, 4 and 5- Explore Control Flow.

Now it’s time for our labs. In the last lab we have created a simple SSIS package demonstrating the ETL process. In this article we will continue our lab and explore some more Control Flow tasks.

Lab 2 - Execute SQL Task

This task let us custom SQL Script via our package.

Step 1. Create Table

Create a table in your SQL database as follows
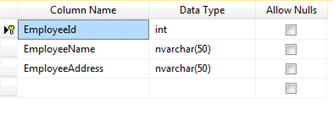
SQL Databse
Note: EmployeeId is identity column.

Step 2. Create SSIS Project

Create a new Empty SSIS project just like one we created in Lab 1.

Step 3. Create Connection Manager

3.1 Right click connection manager and say new ADO.NET connection.
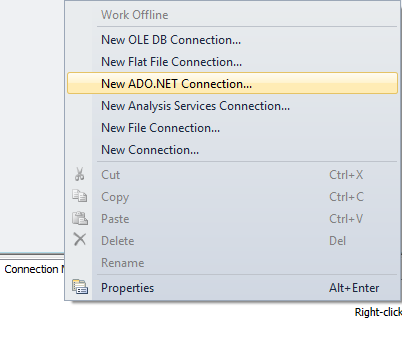
New ADO.NET connection
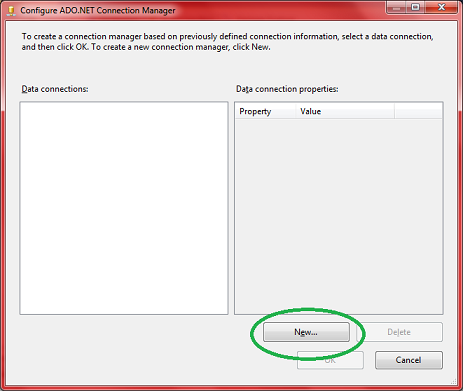
3.2 Click New
Click New
3.3 Enter Server Name, Enter Credential, and Select Database and click OK.
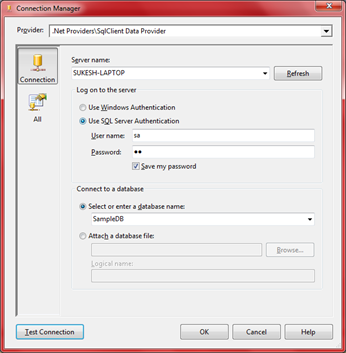
Image 10 for Learn Microsoft Business intelligence step by step – Day 2
3.4 Click Ok again.
3.5 Rename connection manager to Lab2Connection.
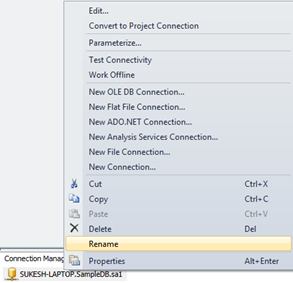
Image 11 for Learn Microsoft Business intelligence step by step – Day 2

Step 4. Add Execute SQL Task

In SSIS Designer by default control flow is selected. Take “Execute SQL Task” from the toolbox and add it in the designer.
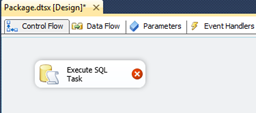
Image 12 for Learn Microsoft Business intelligence step by step – Day 2

Step 5. Configure “Execute SQL Task”

5.1 Double click the task, it will open up “Execute SQL Task Editor”
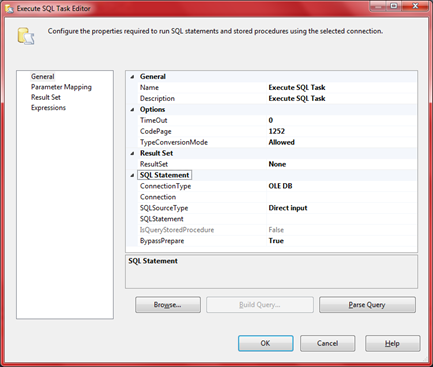
Image 13 for Learn Microsoft Business intelligence step by step – Day 2
5.2 Make sure the left section General is selected. In the right section under SQL Statement group, change connection type to ADO.NET from default OLEDB.
5.3 Next set Connection property to one created in Step 3.
5.4 Next is SQLSourceType. It support three values,
5.4.1 File connection – Let us execute T-SQL Statement stored in a file.
5.4.2 Variable – Let us execute T-SQL statement stored in one of the variable.
5.4.3 Direct Input- let us provide T-SQL statement which we want to execute
Note: On selecting one of the above value, a dynamic option will be displayed in the property window. For “Direct Input” a property called “SQL Statement”, For Variable a property called “Source Variable” and for File Connection property called “File connection” will be dispayed. 
For our select “Direct Input”.
5.5 Click “Sql Statement”. A button with three dots in it will appear. Click it. It will popup “Enter SQL Query” dialog box. Enter query into it and click ok.
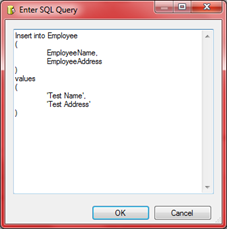
Image 14 for Learn Microsoft Business intelligence step by step – Day 2
5.6 Click Ok in the “Execute SQL Task Editor” window.

Step 6. Execute Package

Press F5 and execute the package.
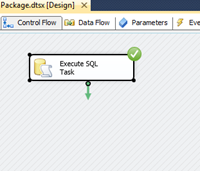
Image 15 for Learn Microsoft Business intelligence step by step – Day 2

Step 7. Test the execution

Open the sql server database and confirm record is instered.
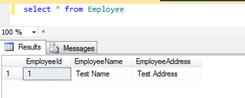
Image 16 for Learn Microsoft Business intelligence step by step – Day 2
Note: We are using hard coded query for demonstration. You can check the identity column and confirm whether actually values are inserted or not.

Step 8. Prepare for next lab

Grab some food, take some rest and be prepare for next lab.
Image 17 for Learn Microsoft Business intelligence step by step – Day 2

Step 3. Add Backup Database Task

Take “Backup database task” from toolbox and add it to control flow designer window

Step 4. Configure Backup Database Task

​4.1 Double click the task, it will pop up the configure window.
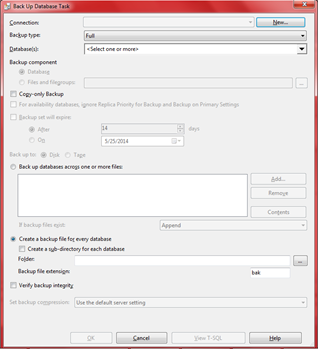
Image 18 for Learn Microsoft Business intelligence step by step – Day 2

4.2 The first thing to configure in connection in the top. Select the connection manager to one created in step 3.
Note: A very strange thing will happen here. You will not find the connection manager (created in step 3) in the drop down. For that,
4.2.1 Close the window.
4.2.2 Right click your connection manager and go to properties.
4.2.3 Check the value of Qualifier property. It will be something like this, “System.Data.SqlClient.SqlConnection, System.Data, Version=4.0.0.0, Culture=neutral, PublicKeyToken=b77a5c561934e089”.
4.2.4 Change it to Simple “SQL”.
4.2.5 Double click the Backup task again. Now you will find the connection manager in dropdown box.
4.3 Just below connection you will find Database(s) option. Select one or more database from the list.
4.4 Let other setting as it is, only select the path where you want to keep database backups.
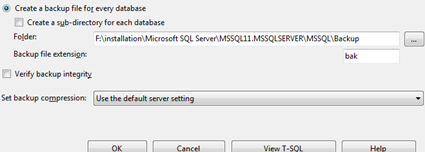
Image 19 for Learn Microsoft Business intelligence step by step – Day 2
4.5 Click Ok

Step 5. Execute the Package

Press F5 and execute the package.
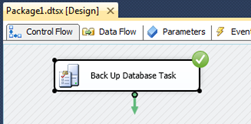
Image 20 for Learn Microsoft Business intelligence step by step – Day 2

Step 6. Test the execution

Go to the chosen path and see if backup is created or not.
If backup file exist it’s time for next lab.

Lab 4 – Script Task and Variables

In this lab we will learn about two things.
  1. Script task – It let us perform something which is not possible using any of the existing SSIS tasks. It let us write code in C# and do custom operations.
  2. Variables – We will learn how to declare variables, how to assign values to them, and how to use them inside Script Task.
Note: Once the variable is created and assign some values we can use it as an input for many tasks. For instance, as an input for Execute SQL Task or may be used inside script task which we are going to do in this lab.

Step 1. Create SSIS Project

Create a new Empty SSIS project.

Step 2. Create Variable and Assign Value

2.1 Do either one of these,
  • Right click the control flow and select Variables.
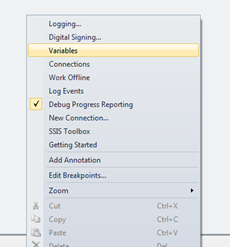
    Image 21 for Learn Microsoft Business intelligence step by step – Day 2
  • Click the blue button located in the right-top corner of SSIS designer.

Image 22 for Learn Microsoft Business intelligence step by step – Day 2
It will open up variable window.
2.2 Click on Add Variable button
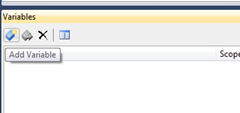
Image 23 for Learn Microsoft Business intelligence step by step – Day 2
2.3 Define the variable and assign the value.
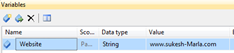
Image 24 for Learn Microsoft Business intelligence step by step – Day 2

Step 3. Add Script task to control flow

Take Script task from the toolbox and add it control flow

Step 4. Configure script task.

4.1 Double click the script task. It will open Script task editor.
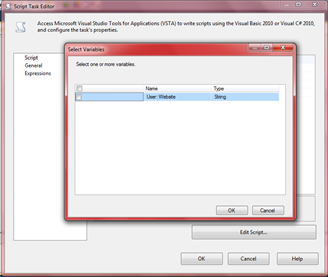
4.2 Next we have to configure what variable we want to pass to the script. We can pass variable as either read only variable or read write variable. Click the triple dot button in front of either ReadOnlyVariable or ReadWriteVariable.
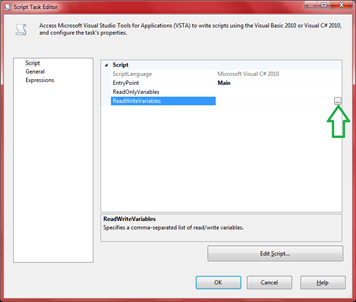
Image 25 for Learn Microsoft Business intelligence step by step – Day 2
Select the variables and click OK.
Image 26 for Learn Microsoft Business intelligence step by step – Day 2
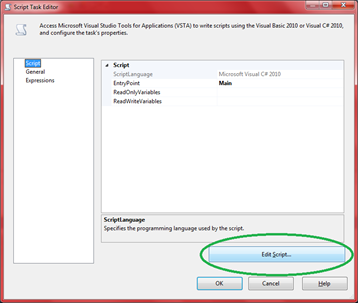
4.3 Next, click on edit script.
Image 27 for Learn Microsoft Business intelligence step by step – Day 2
It will make a new instance of Visual studio open up with a “.cs” extension file.
4.4 In the main Method write the following code.
public void Main()
{
    // TODO: Add your code here
    MessageBox.Show(Dts.Variables["Website"].Value.ToString());
}
4.5 Press Ctrl+Save and save the file.
4.6 Close the Current Visual studio and go back to Sql server data tools where “script task editor” is open.
4.7 Click OK.

Step 5. Execute package.

Press F5 and execute the application.

Step 6. Check the output
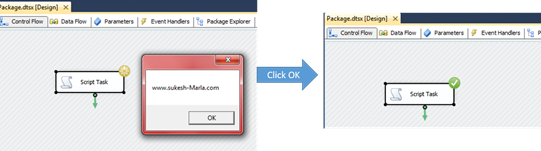
Image 28 for Learn Microsoft Business intelligence step by step – Day 2

Time to celebrate
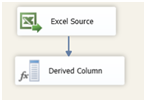
Image 29 for Learn Microsoft Business intelligence step by step – Day 2


Learn Microsoft Business intelligence step by step – Day 1

What all we will do here?

We will start with very basic stuffs like understanding what is mean by Data warehouse and business intelligence and end with creating some complex SSRS Reports.

Complete Series
1.       Day 1 
2.       Day 2
3.       Day 3

Agenda for Day 1
·         What is Data Warehouse?
o    How it is different from Database?
o    What is the purpose of Data Warehouse?
·         What is Business Intelligence?
o    Introduction to Business Intelligence development studio / Sql Server Data tools
·         Basic idea on SSIS, SSAS and SSRS
o    Start with SSIS
·         How we are going to learn?
·         Lab 1 – Simple ETL process using SSIS
o    Problem statement
o    Step by Step Demo
·         Time to celebrate
What is Data Warehouse?

In a very simple word it means, “It's a place where we store all of our data”.

How it is different from Database?

Usually data warehouse is also a database. The records from multiple data sources (may be some other databases)are collected and stored in Denormalized manner. It normally stores months or years of data to support historical analysis
What is Denormalization?
Normalization is a database designing technique which makes sure that there will not be any redundant data.
  • It makes our data more reliable (because there will not be any repeating data. Exiting data will be referred wherever required)
  • It makes database management easy.
  • It reduces the size of database.
Following tables are the part of normalized database.
CityIdCityName
1Mumbai
2Kolkata
3Delhi
CustomerIdCustomerNameCityId
1Sukesh1
2Rajesh1
3Mahesh2
4Ganesh1
At the end of the day Normalized database leads to multiple join conditions in select query and thus affects the performance.
For above example query will be “Select CustomerId, CustomerName, CityName from TblCustomer inner join TblCity on TblCustomer.CityId=tblCity.CityId”
Note: In real time projects there will be more number of tables involved while joining and every table contains many records.
So the solution is Denormalization. We will design the database with repeating data. We will use rare references (or No references) among data, in short, we will repeat the same data wherever required. Denormalized version of above example looks like,
CustomerIdCustomerNameCityName
1SukeshMumbai
2RajeshMumbai
3MaheshKolkata
4GaneshMumbai
Data warehouse summarized
Image 1 for Learn Microsoft Business intelligence step by step – Day 1

What is the purpose of Data Warehouse?

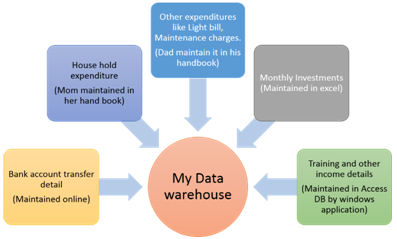
  • As you can see, in the above real life example I collect different data from different places like from my bank account, from the Personal notebook (one maintained by mom containing household expenditure), from investment detail data (stored in Access database) etc.
  • Once I have collected all data, I store them in a separate excel sheet in Denormalized fashion.
  • This new excel sheet (we may refer it as Data warehouse) can be used to make my decisions about my expenses and incomes.
In simple words,Data ware house make us retrieve calculated data quickly and efficiently (without having too many joins in our select query).

What is Business Intelligence?

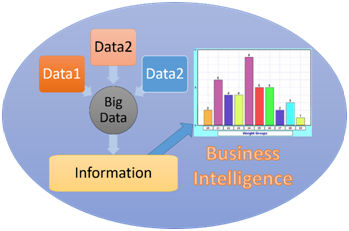
There is a saying that Images are better than long description. Human mind understands graphical explanation more than theoretical explanation. In order to make decision, our information need to be displayed with proper presentation in terms of charts, reports, score cards etc.Initially the concept of data warehouse was all about keeping historical data.
Data warehouse is a foundation for the BI. BI is all about leveraging our existing data and converting them into information or we can say Knowledge. We use this knowledge for making decisions in company.
Image 2 for Learn Microsoft Business intelligence step by step – Day 1
BI or Business Intelligence is simply a solution for
  • Collect information from multiple data sources
  • Transform that data into meaningful information
  • And finally show data to users with elegant presentation.

Introduction to Business Intelligence development studio / Sql Server Data tools

  • In the Microsoft world we will use “Business Intelligence development studio” commonly known as BIDS for this purpose.
  • It’s an IDE which will let us develop Data Analysis and Business Intelligence solutions.
  • It has special project types and tools for developing “Sql server Integration Services”, “Sql server Analysis services” and “Sql server reporting services”. We will learn each of these in a series of step by step article.
  • With the release of Sql Server 2012, BIDS was renamed to Sql Server Data tools.
Note: In this article we will not cover how to install sql server data tools. If you are having any problem in installing please click here.

Basic idea on SSIS, SSAS and SSRS

Step 1. Open Sql Server Data Tools
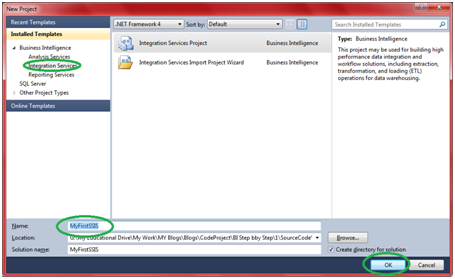
Step 2. Click on File >> New >> Project. A dialog box will popup similar to like this
Image 3 for Learn Microsoft Business intelligence step by step – Day 1
As you can see, it lets us create three kind of project. In order to perform a complete business intelligence task we need to go up with all these three projects.

1. Integration Services – SSIS – Sql server Integration services

It will let us perform wide range of data migration tasks. It let us collect data from various data sources and store them into central location.

2. Analysis Services – SSAS –Sql Server Analysis services

It will let us analyze the data

3. Reporting Services – SSRS – Sql Server Reporting services

It will let us create reports from analyzed data and present it to end user.
We will be doing labs. With every lab we will learn something new, we will reach to a new level in MSBI. We will start with SSIS and then move towards SSAS and finally end up with SSRS. In every article we will include one or more labs.
Image 4 for Learn Microsoft Business intelligence step by step – Day 1
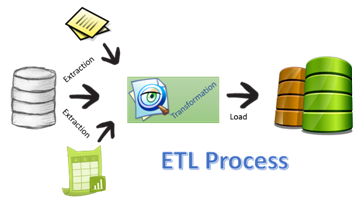
SSIS basically performs three basic things,
  1. Collect data from various sources. – We call it Extraction(E)
  2. Data obtained from different sources may or may not be same format. So first convert all of them according to business needs - We call it Transformation(T)
  3. Load them into one big data source(mostly Data Warehouse) – We call it Load(L)
Together termed as ETL process.
Image 5 for Learn Microsoft Business intelligence step by step – Day 1


Lab 1 – Simple ETL process using SSIS

Problem statement

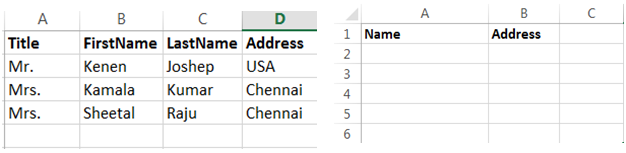
You have Two excel files as follows,
Image 6 for Learn Microsoft Business intelligence step by step – Day 1
  • You will collect data from first file (Datafile.xlsx).
  • Convert that data so that it match to second excel file format (merge Title, FirstName and LastName and call them as Name).
  • Dump final result to second file (Result.xlsx).

Step by Step Demo

Step 1. Create New Project
Click File >> New >> Project. Select Integration Services from the group. Specify some nice name. Say Ok.
Image 7 for Learn Microsoft Business intelligence step by step – Day 1
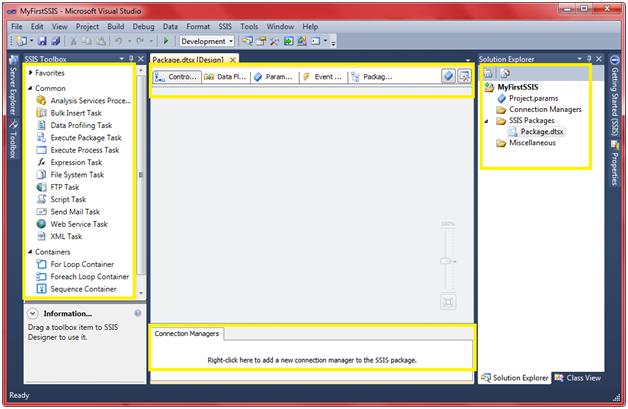
It will open up SSIS designer which you will use for creating and maintaining Integration service packages. It looks like follows,
Image 8 for Learn Microsoft Business intelligence step by step – Day 1
In the solution explorer under “SSIS packages” folder you will see one default package created with name “Package,dtsx”. If you want you can simply “rename it”or “remove it and add new one” (right click the folder and say “New SSIS Package”).
Note: Package is simply a collection of connections, control flow elements, data flow elements, event handlers, parameters etc. We will talk about each one of this as move further.
Step 2. Create Connection Manager for Excel File
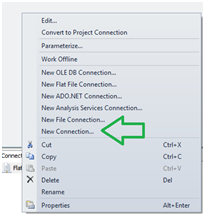
2.1 Right click Connection Manager and Say New Connection.
Image 9 for Learn Microsoft Business intelligence step by step – Day 1
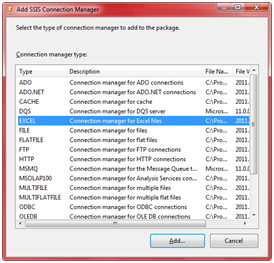
2.2 Select Excel from the popup and click on Add.
Image 10 for Learn Microsoft Business intelligence step by step – Day 1
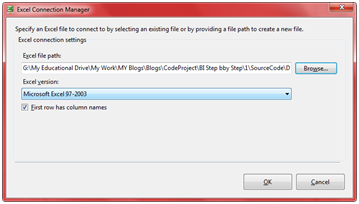
2.3 Click the browse button and select the excel file and click on OK.
Image 11 for Learn Microsoft Business intelligence step by step – Day 1
Step 3. Rename Connection Managers
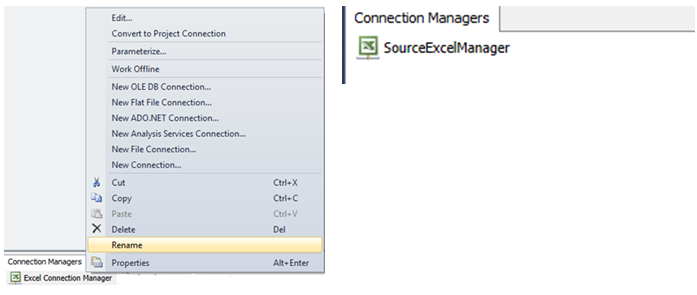
3.1 Right click the connection manager just added and rename it to SourceExcelManager.
Image 12 for Learn Microsoft Business intelligence step by step – Day 1
Step 4. Create Destination connection manager
4.1 Follow the Step no 3 and create one more connection manager pointing to Result.xlsx file.
4.2 Rename connection manager to ExcelDestinationManager.
Step 5. Create control flow – Pass data from Source Excel to Destination Excel.
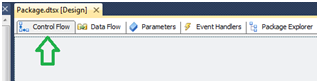
5.1 Make sure control flow tab is selected in SSIS designer.
Image 13 for Learn Microsoft Business intelligence step by step – Day 1
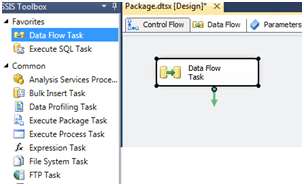
5.2 Select data flow task from the toolbox and drag it into designer.
Image 14 for Learn Microsoft Business intelligence step by step – Day 1
5.3 Rename Data Flow Task to “Source excel to Destination excel transfer task”
Control Flow
Control flow will be used to define the workflow. As the name implies it control the flow of execution.
  • What all tasks need to be executed?
  • What will be the sequence?
  • Whether tasks need to be executed in loops or not?
    Etc.
Step 6. CreateData Flow.
Data Flow
Data Flow defines the flow of data between source and destination.
6.1 Double click the control flow created in last step.
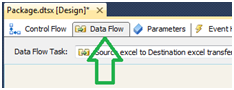
6.2 It will take you to second tab that is Data Flow tab.
Image 15 for Learn Microsoft Business intelligence step by step – Day 1
Step 7. Create Excel Source
7.1 Now you will see a different SSIS toolbox all together. In toolbox you will see couple of groups defined like Sources, Destinations and Transformations.
Take excel source from Source group and place it in designer.
Image 16 for Learn Microsoft Business intelligence step by step – Day 1
Step 8. Configure Excel Source
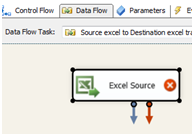
8.1 Red Cross mark on excel source indicates that, it’s not configured yet. Double click the excel source. It will show up a dialog box something like this.
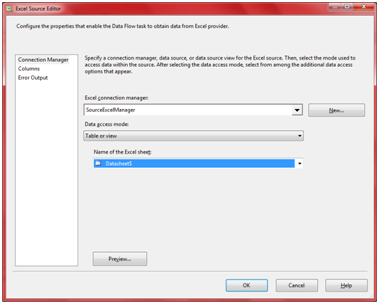
Image 17 for Learn Microsoft Business intelligence step by step – Day 1
8.2 Select Data Source as "SourceExcelManager", Data Access Mode as "Table or View" and Name of the sheet as "DataSheet1" (Name of the sheet in the excel file).
Note: This Excel Source will perform the Extraction Task (E) in the ETL process
Step 9. Create Derived Column
9.1 From the SSIS toolbox from Transformation group drag Derived column to SSIS designer.
Step 10. Connect Source to Derived Column
10.1 Click the Excel source added in prior step.
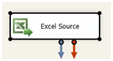
You can see a small blue arrow attached to the source. We call it “Data Flow Path”.
Image 18 for Learn Microsoft Business intelligence step by step – Day 1
Data Flow Path: It lets you define how data will flow.
Click on the blue arrow and connect it to Derived Column.
Image 19 for Learn Microsoft Business intelligence step by step – Day 1
Note: we will speak about the red arrow in one of the future article in the series.
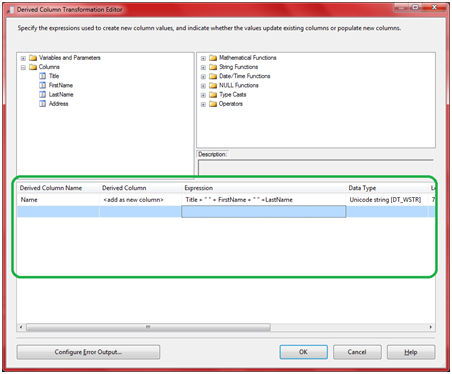
Step 11. Configure the derived column
11.1 Double click the derived column. Popup looks like follows.
Image 20 for Learn Microsoft Business intelligence step by step – Day 1
11.2 Put down Derived Column Name as Name, Select Derived Column as <add>and expression as Title + “ “ + FirstName + “ “ + LastName
11.3 Click Ok.
Note: This DerivedColumn will perform the Transformation Task (T) in the ETL process
Step 12. Create Excel Destination
12.1 Add Excel Destination from the Destination group in SSIS toolbox.
Note: This Excel Destination will perform the Load Task (L) in the ETL process
Step 13. Connect Derived Column to Excel Destination
13.1 Just like step no 10, connect derived column to excel destination.
Step 14. Configure Excel Destination
14.1 Double click the Excel destination, popup looks like follow.
Image 21 for Learn Microsoft Business intelligence step by step – Day 1
14.2 Set connection Manager to “ExcelConnectionManager”, Data Access mode to “Table or View” and Name of the excel sheet to “Datasheet1”.
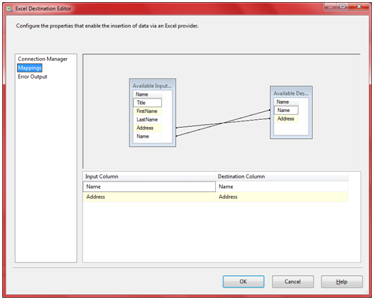
14.3 Click on mapping and make sure its proper, if not make sure to do it before proceeding.
Image 22 for Learn Microsoft Business intelligence step by step – Day 1
Note: In our case, mapping will be already done by the IDE itself (because names of columns are matching).
14.4 Click ok.
Step 15. Execute package
15.1 Press F5.
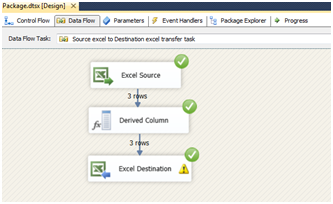
On successful execution you will get a screen something like this.
Image 23 for Learn Microsoft Business intelligence step by step – Day 1
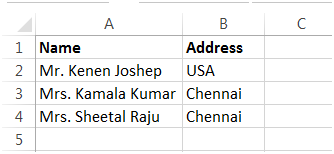
16.2 Open the Result.xlsx file and confirm the output.
Image 24 for Learn Microsoft Business intelligence step by step – Day 1

Time to celebrate
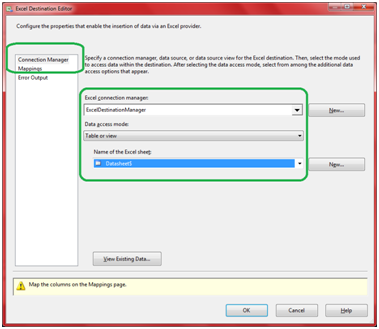
Image 25 for Learn Microsoft Business intelligence step by step – Day 1
We have successfully completed our very first lab on SSIS.