The Visual Studio Interactive window for Python provides a rich read-evaluate-print-loop (REPL) experience that greatly shortens the usual edit-build-debug cycle. The Interactive window provides all the capabilities of the REPL experience of the Python command line. It also makes it very easy to exchange code with source files in the Visual Studio editor, which is otherwise cumbersome with the command line.
Note
For issues with REPL, be sure to have ipython and ipykernel packages installed, and for help installing packages, see Python environments packages tab.
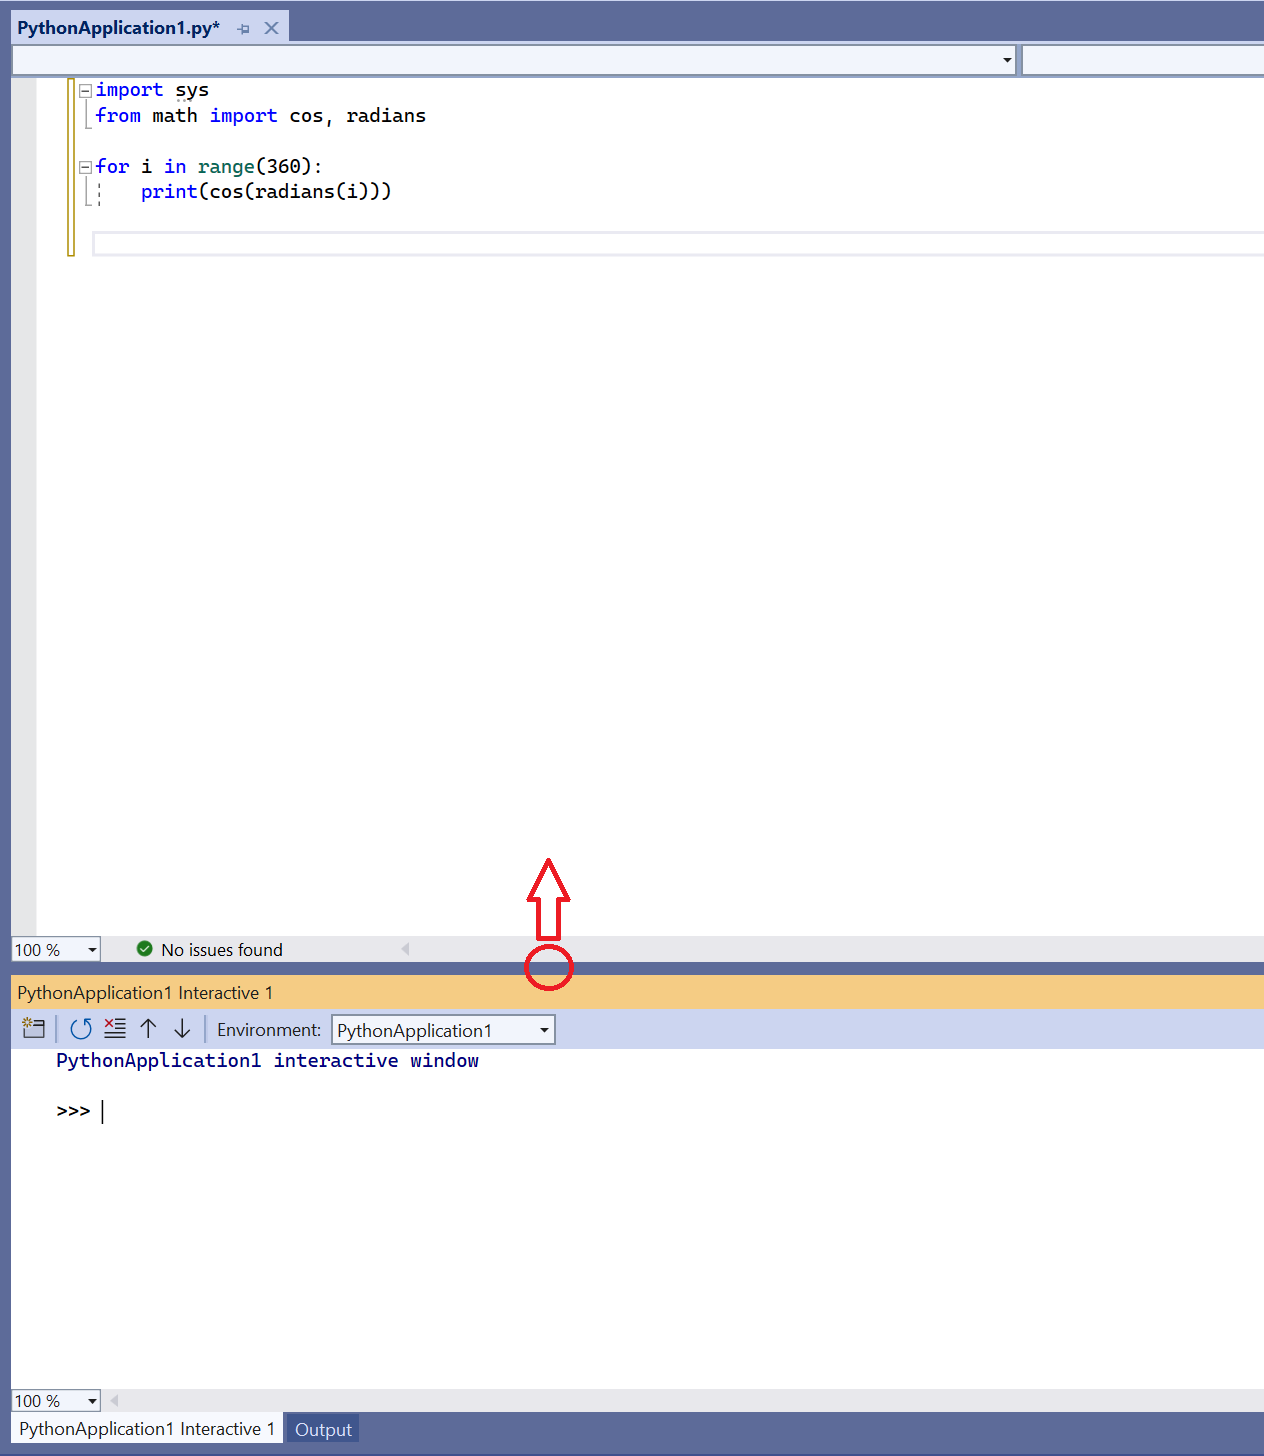
Open the Interactive window by right-clicking the project's Python environment in Solution Explorer (such as Python 3.6 (32-bit) shown in an earlier graphic) and selecting Open Interactive Window. You can alternately select View > Other Windows > Python Interactive Windows from the main Visual Studio menu.
The Interactive window opens below the editor with the standard >>> Python REPL prompt. The Environment drop-down list allows you to select a specific interpreter to work with. Oftentimes you also want to make the Interactive window larger, which you can do by dragging the separator between the two windows:
Tip
You can resize all of the windows in Visual Studio by dragging the bordering separators. You can also drag windows out independently of the Visual Studio frame, and rearrange them however you like within the frame. For complete details, see Customize window layouts.
Enter a few statements like
print("Hello, Visual Studio")and expressions like123/456to see immediate results: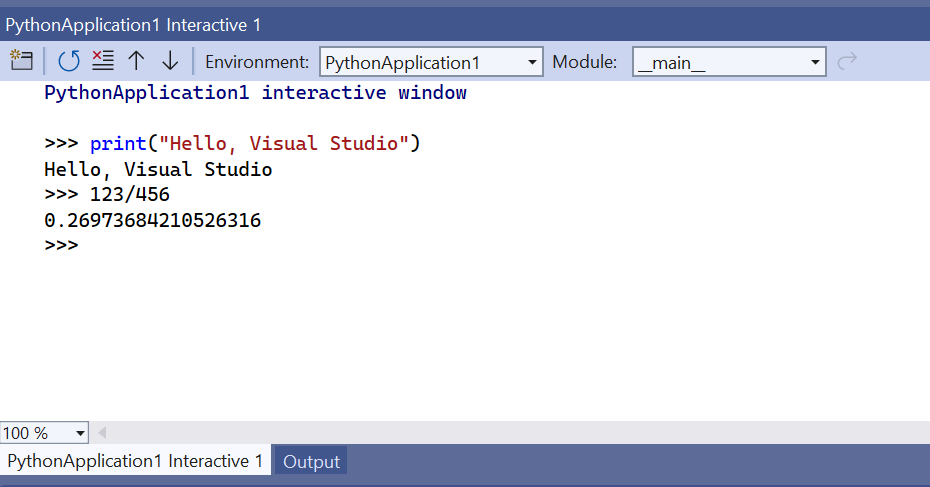
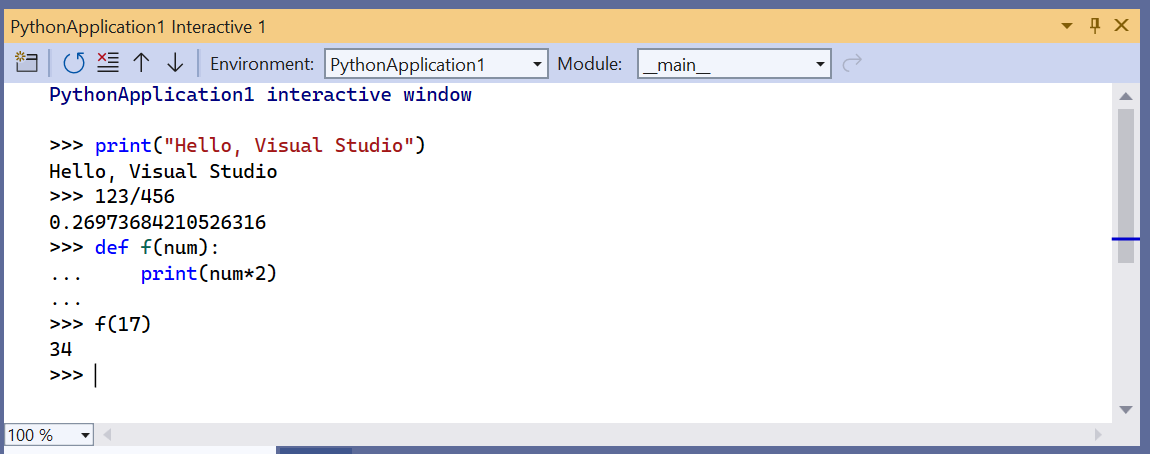
When you start writing a multiline statement, like a function definition, the Interactive window shows Python's ... prompt for continuing lines, which, unlike the command-line REPL, provides automatic indentation:
The Interactive window provides a full history of everything you've entered, and improves upon the command-line REPL with multiline history items. For example, you can easily recall the entire definition of the
ffunction as a single unit and easily change the name tomake_double, rather than re-creating the function line by line.Visual Studio can send multiple lines of code from an editor window to the Interactive window. This capability allows you to maintain code in a source file and easily send select parts of it to the Interactive window. You can then work with such code fragments in the rapid REPL environment rather than having to run the whole program. To see this feature, first replace the
forloop in the PythonApplication1.py file with the following:Python# Create a string with spaces proportional to a cosine of x in degrees def make_dot_string(x): return ' ' * int(20 * cos(radians(x)) + 20) + 'o'Select the
import,from, andmake_dot_stringfunction statements in the .py file. Right-click the selected text and chose Send to Interactive (or press Ctrl+Enter). The code fragment is immediately pasted into the Interactive window and run. Because the code has defined a function, you can quickly test that function by calling it a few times: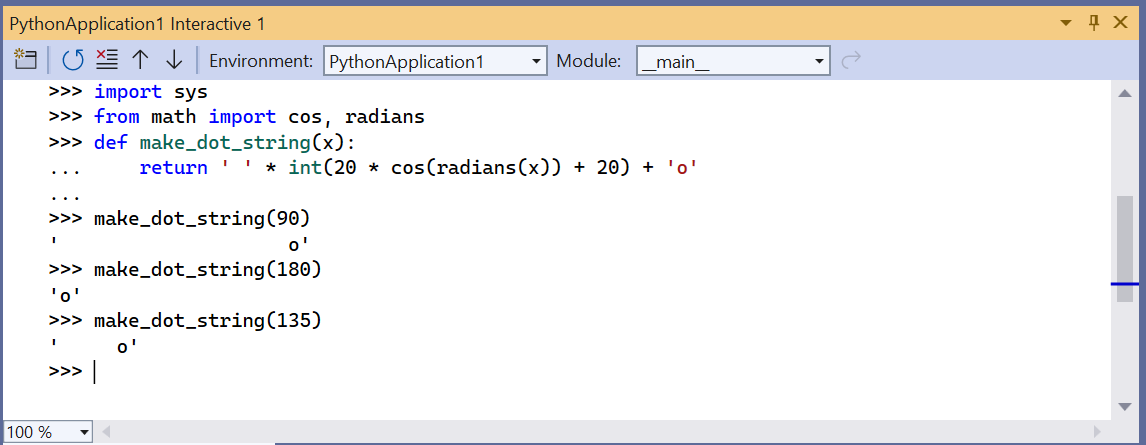
Tip
Using Ctrl+Enter in the editor without a selection runs the current line of code in the Interactive window and automatically places the caret on the next line. With this feature, pressing Ctrl+Enter repeatedly provides a convenient way to step through your code that is not possible with only the Python command line. It also lets you step through your code without running the debugger and without necessarily starting your program from the beginning.
You can also copy and paste multiple lines of code into the Interactive window from any source, such as the snippet below, which is difficult to do with the Python command-line REPL. When pasted, the Interactive window runs that code as if you'd typed it in:
Pythonfor i in range(360): s = make_dot_string(i) print(s)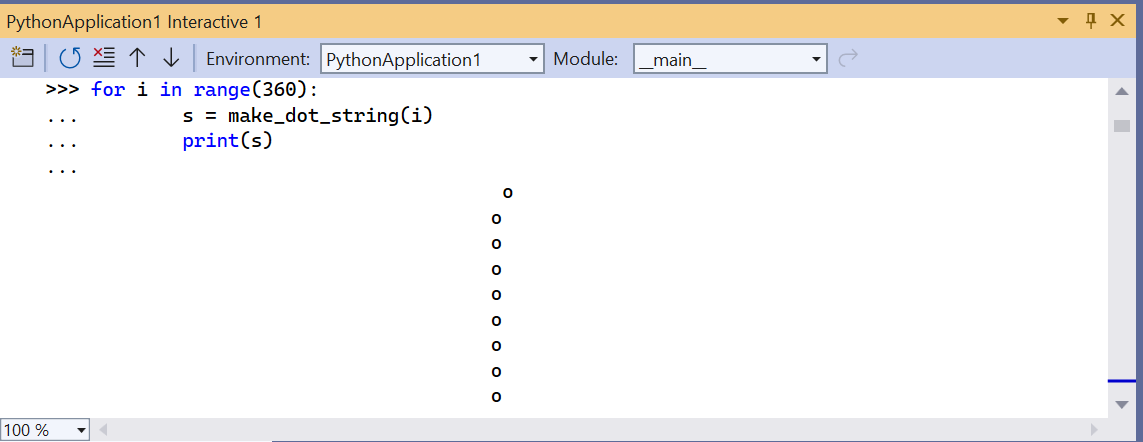
As you can see, this code works fine but its output isn't very inspiring. A different step value in the
forloop would show more of the cosine wave. Fortunately, because the entireforloop is in the REPL history as a single unit, it's easy to go back and make whatever changes you want and then test the function again. Press the up arrow to first recall theforloop. Then press the left or right arrows to start navigating in the code (until you do so, the up and down arrows continue to cycle through the history). Navigate to and change therangespecification torange(0, 360, 12). Then press Ctrl+Enter (anywhere in the code) to run the whole statement again: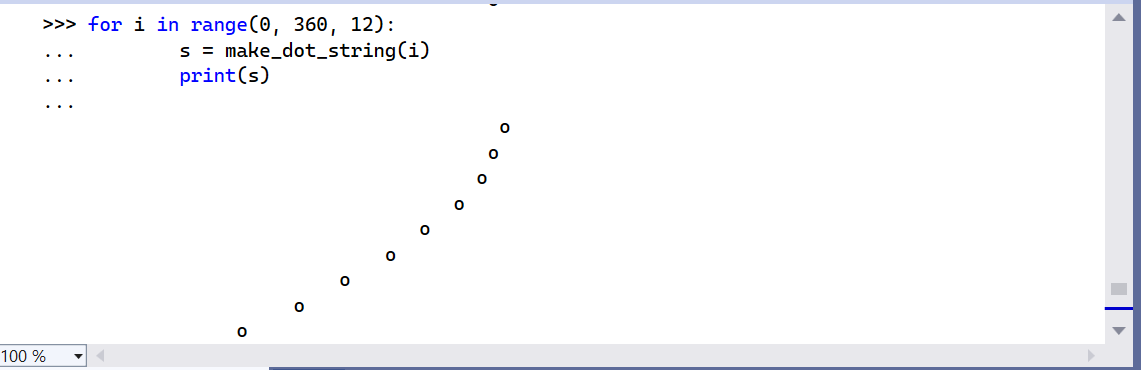
Repeat the process to experiment with different step settings until you find a value you like best. You can also make the wave repeat by lengthening the range, for example,
range(0, 1800, 12).When you're satisfied with the code you wrote in the Interactive window, select it. Next, right-click the code and choose Copy Code (Ctrl+Shift+C). Finally, paste the selected code into the editor. Notice how this special feature of Visual Studio automatically omits any output as well as the
>>>and...prompts. For example, the image below shows using the Copy Code command on a selection that includes prompts and output: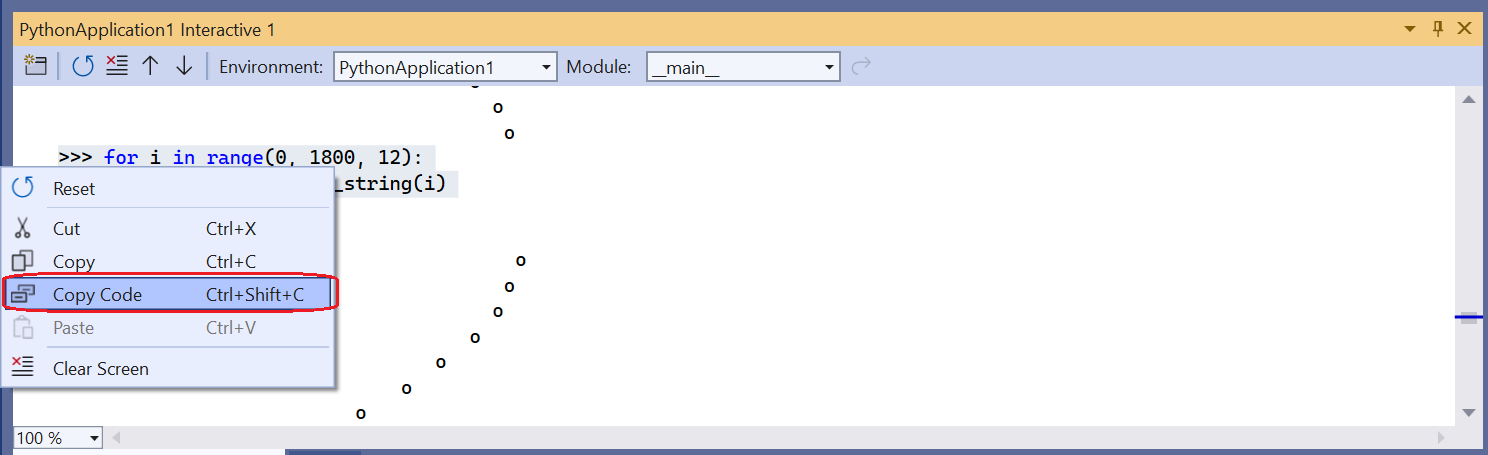
When you paste into the editor, you get only the code:
Pythonfor i in range(0, 1800, 12): s = make_dot_string(i) print(s)If you want to copy the exact contents of the Interactive window, including prompts and output, just use the standard Copy command.
What you've just done is use the rapid REPL environment of the Interactive window to work out the details for a small piece of code, then you conveniently added that code to your project's source file. When you now run the code again with Ctrl+F5 (or Debug > Start without Debugging), you see the exact results you wanted.
No comments:
Post a Comment