Saturday, 30 January 2021

Python- Step 6: Work with Git

 Visual Studio provides direct integration with local Git repositories and remote repositories on services like GitHub and Azure Repos. The integration includes cloning a repository, committing changes, and managing branches.

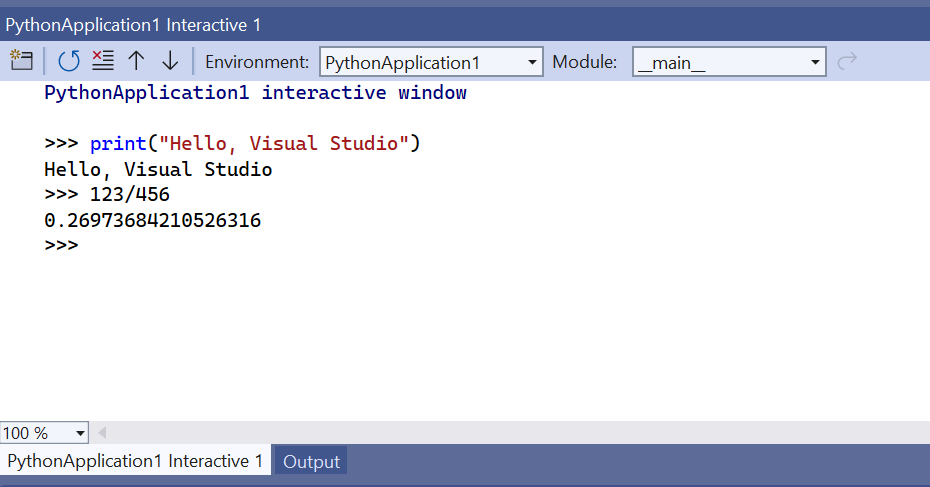
This article provides a basic overview of creating a local Git repository for an existing project, and familiarizing yourself with some of Visual Studio's Git-related features.

  1. With a project open in Visual Studio, such as the project from the previous step, right-click the solution and select Add Solution to Source Control. Visual Studio creates a local Git repository that contains your project code.

  2. When Visual Studio detects that the project is managed in a Git repository Git-related controls appear along the bottom right corner of the Visual Studio window. The controls show pending commits, changes, the name of the repository, and the branch. Hover over the controls to see additional information.

    Additional information appears when hovering over a Git control on the Visual Studio window

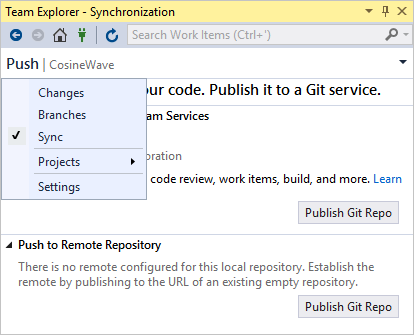
  3. When you create a new repository or select any of the Git controls, Visual Studio opens the Team Explorer window. (You can open the window at any time with the View > Team Explorer menu command.) The window has three main panes, which you switch between using the drop-down on the Team Explorer header. The Sync pane, which provides publishing operations, also appears when you select the Push control (the up arrow icon):

    Team Explorer in Visual Studio after creating a local repository

  4. Select Changes (or the Git control with the pencil icon) to review uncommitted changes and to commit them when desired.

    Team Explorer in Visual Studio showing uncommitted changes

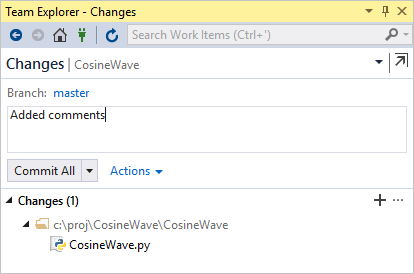
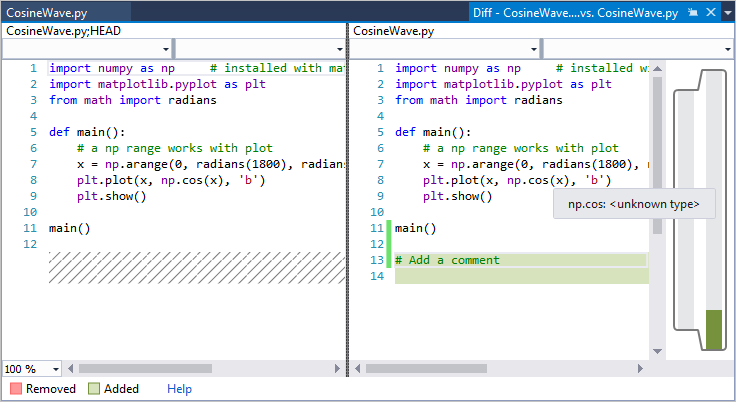
    Double-click a file in the Changes list to open a diff view for that file:

    Diff view for changes to a file

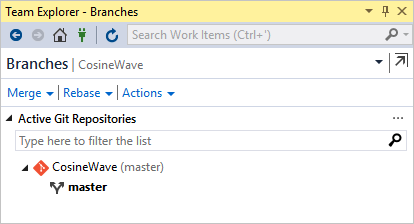
  5. Select Branches (or the Git control with a branch name) to examine branches and perform merge and rebase operations:

    Team Explorer in Visual Studio showing branches

  6. Selecting the Git control with the repository name (CosineWave in a previous image), Team Explorer shows a Connect interface with which you can quickly switch to another repository entirely.

  7. When using a local repository, committed changes go directly into the repository. If you're connected to a remote repository, select the drop-down header in Team Explorer, choose Sync to switch to the Synchronization section, and work with the Pull and Fetch commands presented there.

Go deeper

For a short walkthrough of creating a project from a remote Git repository, see Quickstart: Clone a repository of Python code in Visual Studio.

For a much more comprehensive tutorial, including handling merge conflicts, reviewing code with pull requests, rebasing, and cherry-picking changes between branches, see Get started with Git and Azure Repos.

Python- Step 5: Install packages in your Python environment

 The Python developer community has produced thousands of useful packages that you can incorporate into your own projects. Visual Studio provides a UI to manage packages in your Python environments.

View environments

  1. Select the View > Other Windows > Python Environments menu command. The Python Environments window opens as a peer to Solution Explorer and shows the different environments available to you. The list shows both environments that you installed using the Visual Studio installer and those you installed separately. That includes global, virtual, and conda environments. The environment in bold is the default environment that's used for new projects. For additional information about working with environments, see How to create and manage Python environments in Visual Studio environments.

    Python Environments window

     Note

    You can also open the Python Environments window by selecting the Solution Explorer window and using the Ctrl+K, Ctrl+` keyboard shortcut. If the shortcut doesn't work and you can't find the Python Environments window in the menu, it's possible you haven't installed the Python workload. See How to install Python support in Visual Studio for guidance about how to install Python.

  2. The environment's Overview tab provides quick access to an Interactive window for that environment along with the environment's installation folder and interpreters. For example, select Open interactive window and an Interactive window for that specific environment appears in Visual Studio.

  3. Now, create a new project with File > New > Project, selecting the Python Application template. In the code file that appears, paste the following code, which creates a cosine wave like the previous tutorial steps, only this time plotted graphically. Alternatively, you can use the project you previously created and replace the code.

    Python
    from math import radians
    import numpy as np     # installed with matplotlib
    import matplotlib.pyplot as plt
    
    def main():
        x = np.arange(0, radians(1800), radians(12))
        plt.plot(x, np.cos(x), 'b')
        plt.show()
    
    main()
    
  4. With a Python project open, you can also open the Python Environments window from Solution Explorer by right-clicking Python Environments and selecting View All Python Environments

    Environment

  5. Looking at the editor window, you'll notice that if you hover over the numpy and matplotlib import statements that they are not resolved. That's because the packages have not been installed to the default global environment.

    Unresolved package import

Install packages using the Python Environments window

  1. From the Python Environments window, select the default environment for new Python projects and choose the Packages tab. You will then see a list of packages that are currently installed in the environment.

    Packages installed in an environment

  2. Install matplotlib by entering its name into the search field and then selecting the Run command: pip install matplotlib option. This will install matplotlib, as well as any packages it depends on (in this case that includes numpy).

    Installing matplotlib in the environment

  3. Consent to elevation if prompted to do so.

  4. After the package is installed, it appears in the Python Environments window. The X to the right of the package uninstalls it.

    Completion of installing matplotlib in the environment

     Note

    A small progress bar might appear underneath the environment to indicate that Visual Studio is building its IntelliSense database for the newly-installed package. The IntelliSense tab also shows more detailed information. Be aware that until that database is complete, IntelliSense features like auto-completion and syntax checking won't be active in the editor for that package.

    Visual Studio 2017 version 15.6 and later uses a different and faster method for working with IntelliSense, and displays a message to that effect on the IntelliSense tab.

Run the program

  1. Now that matplotlib is installed, run the program with (F5) or without the debugger (Ctrl+F5) to see the output:

    Output of matplotlib example

Python- Step 4: Run code in the debugger

 In addition to managing projects, providing a rich editing experience, and the Interactive window, Visual Studio provides full-featured debugging for Python code. In the debugger, you can run your code step by step, including every iteration of a loop. You can also pause the program whenever certain conditions are true. At any point when the program is paused in the debugger, you can examine the entire program state and change the value of variables. Such actions are essential for tracking down program bugs, and also provide very helpful aids for carefully following the exact program flow.

  1. Replace the code in the PythonApplication1.py file with the following. This variation of the code expands make_dot_string so that you can examine its discrete steps in the debugger. It also places the for loop into a main function and runs it explicitly by calling that function:

    Python
    from math import cos, radians
    
    # Create a string with spaces proportional to a cosine of x in degrees
    def make_dot_string(x):
        rad = radians(x)                             # cos works with radians
        numspaces = int(20 * cos(rad) + 20)          # scale to 0-40 spaces
        st = ' ' * numspaces + 'o'                   # place 'o' after the spaces
        return st
    
    def main():
        for i in range(0, 1800, 12):
            s = make_dot_string(i)
            print(s)
    
    main()
    
  2. Check that the code works properly by pressing F5 or selecting the Debug > Start Debugging menu command. This command runs the code in the debugger, but because you haven't done anything to pause the program while it's running, it just prints a wave pattern for a few iterations. Press any key to close the output window.

     Tip

    To close the output window automatically when the program completes, select the Tools > Options menu command, expand the Python node, select Debugging, and then clear the option Wait for input when process exits normally:

    Python debugging option to close the output window on normal program exit

  3. Set a breakpoint on the for statement by clicking once in the gray margin by that line, or by placing the caret in that line and using the Debug > Toggle Breakpoint command (F9). A red dot appears in the gray margin to indicate the breakpoint (as noted by the arrow below):

    Setting a breakpoint

  4. Start the debugger again (F5) and see that running the code stops on the line with that breakpoint. Here you can inspect the call stack and examine variables. Variables that are in-scope appear in the Autos window when they're defined; you can also switch to the Locals view at the bottom of that window to show all variables that Visual Studio finds in the current scope (including functions), even before they're defined:

    Breakpoint UI experience for Python

  5. Observe the debugging toolbar (shown below) along the top of the Visual Studio window. This toolbar provides quick access to the most common debugging commands (which can also be found on the Debug menu):

    Essential debugging toolbar buttons

    The buttons from left to right as follows:

    • Continue (F5) runs the program until the next breakpoint or until program completion.
    • Break All (Ctrl+Alt+Break) pauses a long-running program.
    • Stop Debugging (Shift+F5) stops the program wherever it is, and exits the debugger.
    • Restart (Ctrl+Shift+F5) stops the program wherever it is, and restarts it from the beginning in the debugger.
    • Show Next Statement (Alt+Num *) switches to the next line of code to run. This is most helpful when you navigate around within your code during a debugging session and want to quickly return to the point where the debugger is paused.
    • Step Into (F11) runs the next line of code, entering into called functions.
    • Step Over (F10) runs the next line of code without entering into called functions.
    • Step Out (Shift+F11) runs the remainder of the current function and pauses in the calling code.
  6. Step over the for statement using Step OverStepping means that the debugger runs the current line of code, including any function calls, and then immediately pauses again. Notice how the variable i is now defined in the Locals and Autos windows.

  7. Step over the next line of code, which calls make_dot_string and pauses. Step Over here specifically means that the debugger runs the whole of make_dot_string and pauses when it returns. The debugger does not stop inside that function unless a separate breakpoint exists there.

  8. Continue stepping over the code a few more times and observe how the values in the Locals or Autos window change.

  9. In the Locals or Autos window, double-click in the Value column for either the i or s variables to edit the value. Press Enter or click any area outside that value to apply any changes.

  10. Continue stepping through the code using Step IntoStep Into means that the debugger enters inside any function call for which it has debugging information, such as make_dot_string. Once inside make_dot_string you can examine its local variables and step through its code specifically.

  11. Continue stepping with Step Into and notice that when you reach the end of the make_dot_string, the next step returns to the for loop with the new return value in the s variable. As you step again to the print statement, notice that Step Into on print does not enter into that function. This is because print is not written in Python but is rather native code inside the Python runtime.

  12. Continue using Step Into until you're again partway into make_dot_string. Then use Step Out and notice that you return to the for loop. With Step Out, the debugger runs the remainder of the function and then automatically pauses in the calling code. This is very helpful when you've stepped through some portion of a lengthy function that you wish to debug, but don't need to step through the rest and don't want to set an explicit breakpoint in the calling code.

  13. To continue running the program until the next breakpoint is reached, use Continue (F5). Because you have a breakpoint in the for loop, you break on the next iteration.

  14. Stepping through hundreds of iterations of a loop can be tedious, so Visual Studio lets you add a condition to a breakpoint. The debugger then pauses the program at the breakpoint only when the condition is met. For example, you can use a condition with the breakpoint on the for statement so that it pauses only when the value of i exceeds 1600. To set this condition, right-click the red breakpoint dot and select Conditions (Alt+F9 > C). In the Breakpoint Settings popup that appears, enter i > 1600 as the expression and select Close. Press F5 to continue and observe that the program runs many iterations before the next break.

    Setting a breakpoint condition

  15. To run the program to completion, disable the breakpoint by right-clicking the dot in the margin and selecting Disable breakpoint (Ctrl+F9). Then select Continue (or press F5) to run the program. When the program ends, Visual Studio stops its debugging session and returns to its editing mode. Note that you can also delete the breakpoint by selecting its dot or by right-clicking the dot and selecting Delete breakpoint, but this also deletes any condition you've set.

 Tip

In some situations, such as a failure to launch the Python interpreter itself, the output window may appear only briefly and then close automatically without giving you a chance to see any errors messages. If this happens, right-click the project in Solution Explorer, select Properties, select the Debug tab, then add -i to the Interpreter Arguments field. This argument causes the interpreter to go into interactive mode after a program completes, thereby keeping the window open until you enter Ctrl+Z > Enter to exit.

Python- Step 3: Use the Interactive REPL window

 The Visual Studio Interactive window for Python provides a rich read-evaluate-print-loop (REPL) experience that greatly shortens the usual edit-build-debug cycle. The Interactive window provides all the capabilities of the REPL experience of the Python command line. It also makes it very easy to exchange code with source files in the Visual Studio editor, which is otherwise cumbersome with the command line.

 Note

For issues with REPL, be sure to have ipython and ipykernel packages installed, and for help installing packages, see Python environments packages tab.

  1. Open the Interactive window by right-clicking the project's Python environment in Solution Explorer (such as Python 3.6 (32-bit) shown in an earlier graphic) and selecting Open Interactive Window. You can alternately select View > Other Windows > Python Interactive Windows from the main Visual Studio menu.

  2. The Interactive window opens below the editor with the standard >>> Python REPL prompt. The Environment drop-down list allows you to select a specific interpreter to work with. Oftentimes you also want to make the Interactive window larger, which you can do by dragging the separator between the two windows:

    Python interactive window and dragging to resize

     Tip

    You can resize all of the windows in Visual Studio by dragging the bordering separators. You can also drag windows out independently of the Visual Studio frame, and rearrange them however you like within the frame. For complete details, see Customize window layouts.

  3. Enter a few statements like print("Hello, Visual Studio") and expressions like 123/456 to see immediate results:

    Python interactive window immediate results

  4. When you start writing a multiline statement, like a function definition, the Interactive window shows Python's ... prompt for continuing lines, which, unlike the command-line REPL, provides automatic indentation:

    Python interactive window with statement continuation

  5. The Interactive window provides a full history of everything you've entered, and improves upon the command-line REPL with multiline history items. For example, you can easily recall the entire definition of the f function as a single unit and easily change the name to make_double, rather than re-creating the function line by line.

  6. Visual Studio can send multiple lines of code from an editor window to the Interactive window. This capability allows you to maintain code in a source file and easily send select parts of it to the Interactive window. You can then work with such code fragments in the rapid REPL environment rather than having to run the whole program. To see this feature, first replace the for loop in the PythonApplication1.py file with the following:

    Python
    # Create a string with spaces proportional to a cosine of x in degrees
    def make_dot_string(x):
        return ' ' * int(20 * cos(radians(x)) + 20) + 'o'
    
  7. Select the importfrom, and make_dot_string function statements in the .py file. Right-click the selected text and chose Send to Interactive (or press Ctrl+Enter). The code fragment is immediately pasted into the Interactive window and run. Because the code has defined a function, you can quickly test that function by calling it a few times:

    Sending code to the interactive window and testing it

     Tip

    Using Ctrl+Enter in the editor without a selection runs the current line of code in the Interactive window and automatically places the caret on the next line. With this feature, pressing Ctrl+Enter repeatedly provides a convenient way to step through your code that is not possible with only the Python command line. It also lets you step through your code without running the debugger and without necessarily starting your program from the beginning.

  8. You can also copy and paste multiple lines of code into the Interactive window from any source, such as the snippet below, which is difficult to do with the Python command-line REPL. When pasted, the Interactive window runs that code as if you'd typed it in:

    Python
    for i in range(360):
        s = make_dot_string(i)
        print(s)
    

    Pasting multiple lines of code using Sending Interactive

  9. As you can see, this code works fine but its output isn't very inspiring. A different step value in the for loop would show more of the cosine wave. Fortunately, because the entire for loop is in the REPL history as a single unit, it's easy to go back and make whatever changes you want and then test the function again. Press the up arrow to first recall the for loop. Then press the left or right arrows to start navigating in the code (until you do so, the up and down arrows continue to cycle through the history). Navigate to and change the range specification to range(0, 360, 12). Then press Ctrl+Enter (anywhere in the code) to run the whole statement again:

    Editing a previous statement in the interactive window

  10. Repeat the process to experiment with different step settings until you find a value you like best. You can also make the wave repeat by lengthening the range, for example, range(0, 1800, 12).

  11. When you're satisfied with the code you wrote in the Interactive window, select it. Next, right-click the code and choose Copy Code (Ctrl+Shift+C). Finally, paste the selected code into the editor. Notice how this special feature of Visual Studio automatically omits any output as well as the >>> and ... prompts. For example, the image below shows using the Copy Code command on a selection that includes prompts and output:

    Interactive window copy code command on a selection with prompts and output

    When you paste into the editor, you get only the code:

    Python
    for i in range(0, 1800, 12):
        s = make_dot_string(i)
        print(s)
    

    If you want to copy the exact contents of the Interactive window, including prompts and output, just use the standard Copy command.

  12. What you've just done is use the rapid REPL environment of the Interactive window to work out the details for a small piece of code, then you conveniently added that code to your project's source file. When you now run the code again with Ctrl+F5 (or Debug > Start without Debugging), you see the exact results you wanted.