Question #211
DRAG DROP -
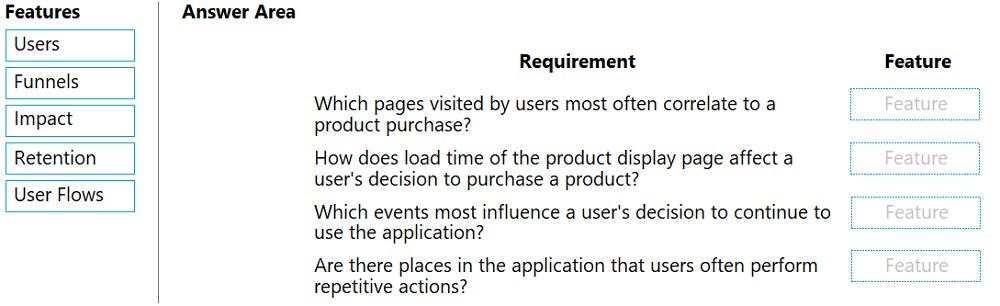
You develop an ASP.NET Core MVC application. You configure the application to track webpages and custom events.
You need to identify trends in application usage.
Which Azure Application Insights Usage Analysis features should you use? To answer, drag the appropriate features to the correct requirements. Each feature may be used once, more than once, or not at all. You may need to drag the split bar between panes or scroll to view content.
NOTE: Each correct selection is worth one point.
Select and Place:
Correct Answer:
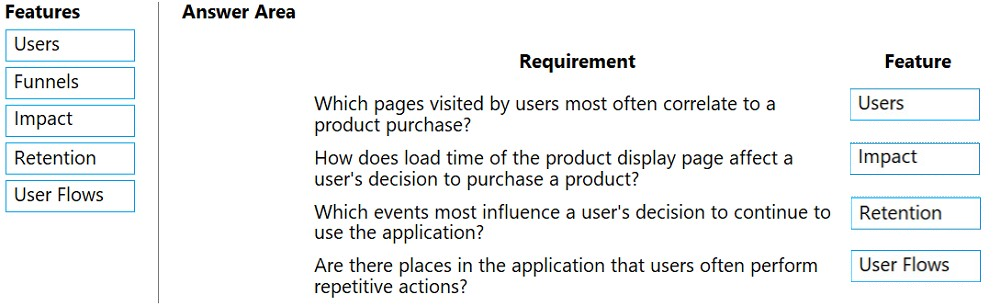
Box 1: Users -
Box 2: Impact -
One way to think of Impact is as the ultimate tool for settling arguments with someone on your team about how slowness in some aspect of your site is affecting whether users stick around. While users may tolerate a certain amount of slowness, Impact gives you insight into how best to balance optimization and performance to maximize user conversion.
Box 3: Retention -
The retention feature in Azure Application Insights helps you analyze how many users return to your app, and how often they perform particular tasks or achieve goals. For example, if you run a game site, you could compare the numbers of users who return to the site after losing a game with the number who return after winning. This knowledge can help you improve both your user experience and your business strategy.
Box 4: User flows -
The User Flows tool visualizes how users navigate between the pages and features of your site. It's great for answering questions like:
✑ How do users navigate away from a page on your site?
✑ What do users click on a page on your site?
✑ Where are the places that users churn most from your site?
✑ Are there places where users repeat the same action over and over?
Incorrect Answers:
Funnel: If your application involves multiple stages, you need to know if most customers are progressing through the entire process, or if they are ending the process at some point. The progression through a series of steps in a web application is known as a funnel. You can use Azure Application Insights Funnels to gain insights into your users, and monitor step-by-step conversion rates.
Reference:
https://docs.microsoft.com/en-us/azure/azure-monitor/app/usage-impact
Question #212
You develop a gateway solution for a public facing news API. The news API back end is implemented as a RESTful service and uses an OpenAPI specification.
You need to ensure that you can access the news API by using an Azure API Management service instance.
Which Azure PowerShell command should you run?
You need to ensure that you can access the news API by using an Azure API Management service instance.
Which Azure PowerShell command should you run?
Question #213
You are creating a hazard notification system that has a single signaling server which triggers audio and visual alarms to start and stop.
You implement Azure Service Bus to publish alarms. Each alarm controller uses Azure Service Bus to receive alarm signals as part of a transaction. Alarm events must be recorded for audit purposes. Each transaction record must include information about the alarm type that was activated.
You need to implement a reply trail auditing solution.
Which two actions should you perform? Each correct answer presents part of the solution.
NOTE: Each correct selection is worth one point.
Question #214
You are developing an Azure function that connects to an Azure SQL Database instance. The function is triggered by an Azure Storage queue.
You receive reports of numerous System.InvalidOperationExceptions with the following message:
`Timeout expired. The timeout period elapsed prior to obtaining a connection from the pool. This may have occurred because all pooled connections were in use and max pool size was reached.`
You need to prevent the exception.
What should you do?
Question #215
Note: This question is part of a series of questions that present the same scenario. Each question in the series contains a unique solution. Determine whether the solution meets the stated goals.
You are developing and deploying several ASP.NET web applications to Azure App Service. You plan to save session state information and HTML output.
You must use a storage mechanism with the following requirements:
✑ Share session state across all ASP.NET web applications.
✑ Support controlled, concurrent access to the same session state data for multiple readers and a single writer.
✑ Save full HTTP responses for concurrent requests.
You need to store the information.
Proposed Solution: Deploy and configure Azure Cache for Redis. Update the web applications.
Does the solution meet the goal?
Question #216
HOTSPOT -
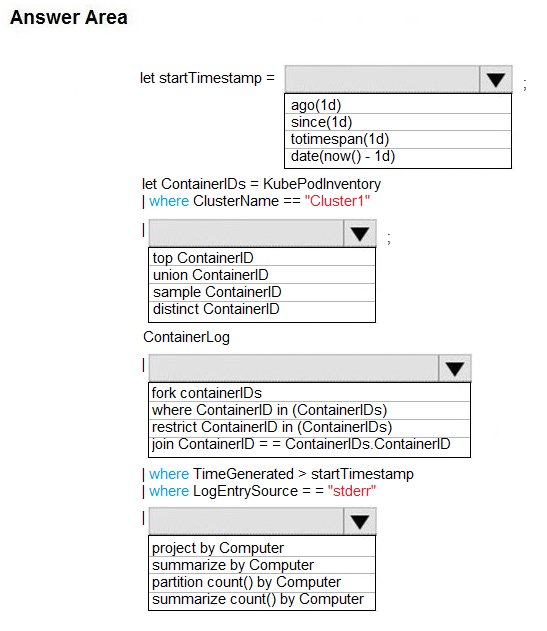
You are debugging an application that is running on Azure Kubernetes cluster named cluster1. The cluster uses Azure Monitor for containers to monitor the cluster.
The application has sticky sessions enabled on the ingress controller.
Some customers report a large number of errors in the application over the last 24 hours.
You need to determine on which virtual machines (VMs) the errors are occurring.
How should you complete the Azure Monitor query? To answer, select the appropriate options in the answer area.
NOTE: Each correct selection is worth one point.
Hot Area:
Correct Answer:
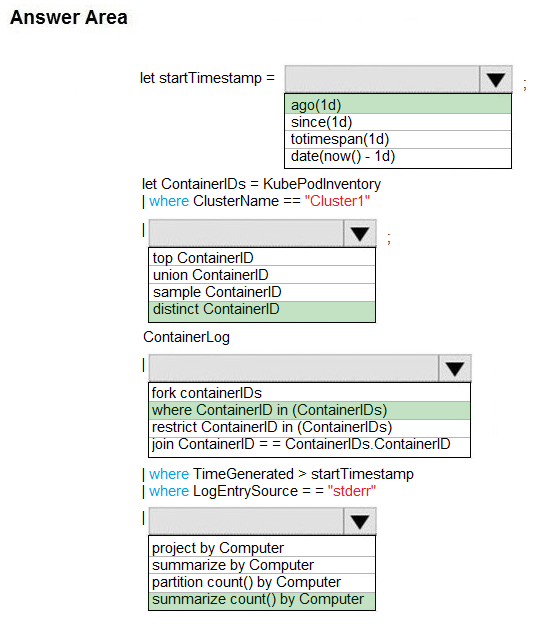
Box 1: ago(1d)
Box 2: distinct containerID -
Box 3: where ContainerID in (ContainerIDs)
Box 4: summarize Count by Computer
Summarize: aggregate groups of rows
Use summarize to identify groups of records, according to one or more columns, and apply aggregations to them. The most common use of summarize is count, which returns the number of results in each group.
Reference:
https://docs.microsoft.com/en-us/azure/azure-monitor/log-query/get-started-queries https://docs.microsoft.com/en-us/azure/azure-monitor/log-query/query-optimization
Question #217
HOTSPOT -
You plan to deploy a web app to App Service on Linux. You create an App Service plan. You create and push a custom Docker image that contains the web app to Azure Container Registry.
You need to access the console logs generated from inside the container in real-time.
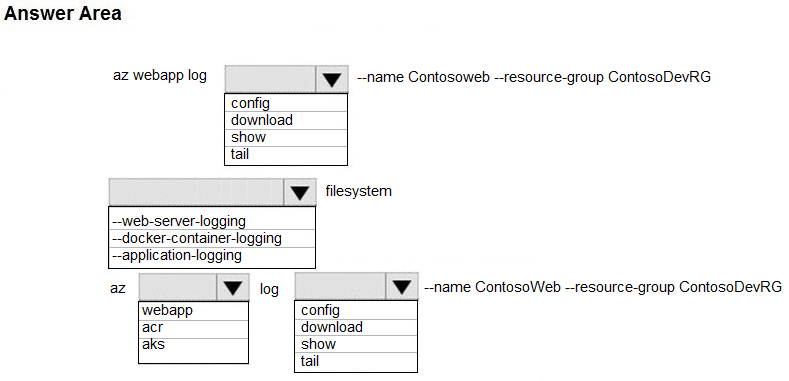
How should you complete the Azure CLI command? To answer, select the appropriate options in the answer area.
NOTE: Each correct selection is worth one point.
Hot Area:
You plan to deploy a web app to App Service on Linux. You create an App Service plan. You create and push a custom Docker image that contains the web app to Azure Container Registry.
You need to access the console logs generated from inside the container in real-time.
How should you complete the Azure CLI command? To answer, select the appropriate options in the answer area.
NOTE: Each correct selection is worth one point.
Hot Area:
Correct Answer:
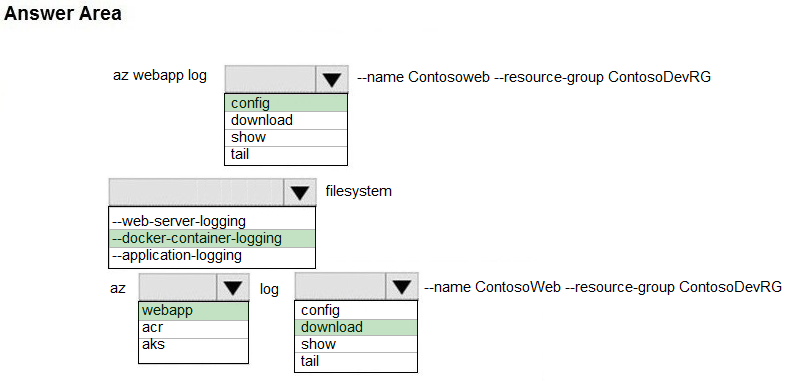
Box 1: config -
To Configure logging for a web app use the command:
az webapp log config
Box 2: --docker-container-logging
Syntax include:
az webapp log config [--docker-container-logging {filesystem, off}]
Box 3: webapp -
To download a web app's log history as a zip file use the command: az webapp log download
Box 4: download -
Reference:
https://docs.microsoft.com/en-us/cli/azure/webapp/log
Question #218
You develop and deploy an ASP.NET web app to Azure App Service. You use Application Insights telemetry to monitor the app.
You must test the app to ensure that the app is available and responsive from various points around the world and at regular intervals. If the app is not responding, you must send an alert to support staff.
You need to configure a test for the web app.
Which two test types can you use? Each correct answer presents a complete solution.
NOTE: Each correct selection is worth one point.
Question #219
DRAG DROP -
A web service provides customer summary information for e-commerce partners. The web service is implemented as an Azure Function app with an HTTP trigger.
Access to the API is provided by an Azure API Management instance. The API Management instance is configured in consumption plan mode. All API calls are authenticated by using OAuth.
API calls must be cached. Customers must not be able to view cached data for other customers.
You need to configure API Management policies for caching.
How should you complete the policy statement?
Select and Place:
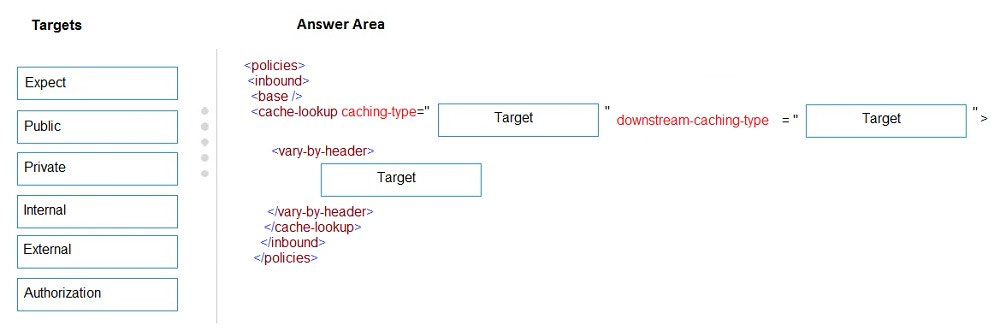
Correct Answer:
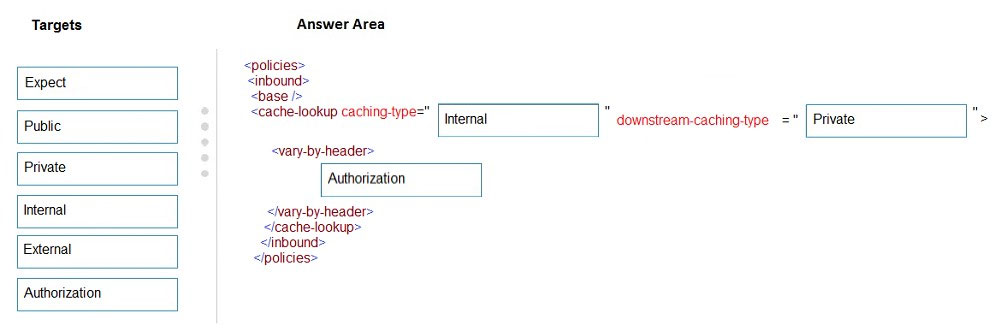
Box 1: internal -
caching-type
Choose between the following values of the attribute:
✑ internal to use the built-in API Management cache,
✑ external to use the external cache as Azure Cache for Redis prefer-external to use external cache if configured or internal cache otherwise.

Box 2: private -
downstream-caching-type
This attribute must be set to one of the following values.
✑ none - downstream caching is not allowed.
✑ private - downstream private caching is allowed.
✑ public - private and shared downstream caching is allowed.
Box 3: Authorization -
<vary-by-header>Authorization</vary-by-header>
<!-- should be present when allow-private-response-caching is "true"-->
Note: Start caching responses per value of specified header, such as Accept, Accept-Charset, Accept-Encoding, Accept-Language, Authorization, Expect, From,
Host, If-Match -
Reference:
https://docs.microsoft.com/en-us/azure/api-management/api-management-caching-policies
Box 1: internal -
caching-type
Choose between the following values of the attribute:
✑ internal to use the built-in API Management cache,
✑ external to use the external cache as Azure Cache for Redis prefer-external to use external cache if configured or internal cache otherwise.
Box 2: private -
downstream-caching-type
This attribute must be set to one of the following values.
✑ none - downstream caching is not allowed.
✑ private - downstream private caching is allowed.
✑ public - private and shared downstream caching is allowed.
Box 3: Authorization -
<vary-by-header>Authorization</vary-by-header>
<!-- should be present when allow-private-response-caching is "true"-->
Note: Start caching responses per value of specified header, such as Accept, Accept-Charset, Accept-Encoding, Accept-Language, Authorization, Expect, From,
Host, If-Match -
Reference:
https://docs.microsoft.com/en-us/azure/api-management/api-management-caching-policies
Question #220
You are developing applications for a company. You plan to host the applications on Azure App Services.
The company has the following requirements:
✑ Every five minutes verify that the websites are responsive.
✑ Verify that the websites respond within a specified time threshold. Dependent requests such as images and JavaScript files must load properly.
✑ Generate alerts if a website is experiencing issues.
✑ If a website fails to load, the system must attempt to reload the site three more times.
You need to implement this process with the least amount of effort.
What should you do?
Question #221
You develop and add several functions to an Azure Function app that uses the latest runtime host. The functions contain several REST API endpoints secured by using SSL. The Azure Function app runs in a Consumption plan.
You must send an alert when any of the function endpoints are unavailable or responding too slowly.
You need to monitor the availability and responsiveness of the functions.
What should you do?
You must send an alert when any of the function endpoints are unavailable or responding too slowly.
You need to monitor the availability and responsiveness of the functions.
What should you do?
Question #222
DRAG DROP -
You are developing an application to retrieve user profile information. The application will use the Microsoft Graph SDK.
The app must retrieve user profile information by using a Microsoft Graph API call.
You need to call the Microsoft Graph API from the application.
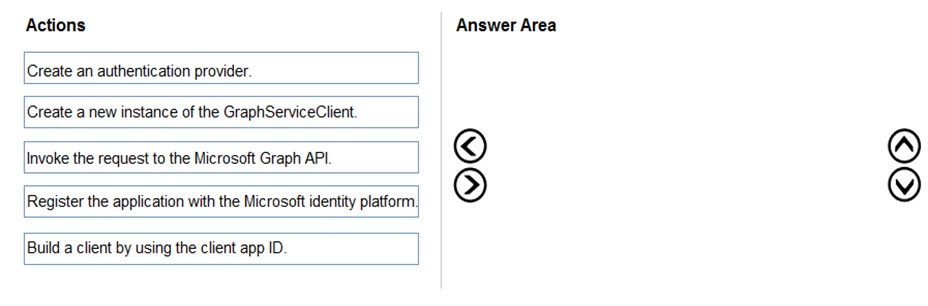
In which order should you perform the actions? To answer, move all actions from the list of actions to the answer area and arrange them in the correct order.
Select and Place:
You are developing an application to retrieve user profile information. The application will use the Microsoft Graph SDK.
The app must retrieve user profile information by using a Microsoft Graph API call.
You need to call the Microsoft Graph API from the application.
In which order should you perform the actions? To answer, move all actions from the list of actions to the answer area and arrange them in the correct order.
Select and Place:
Correct Answer:
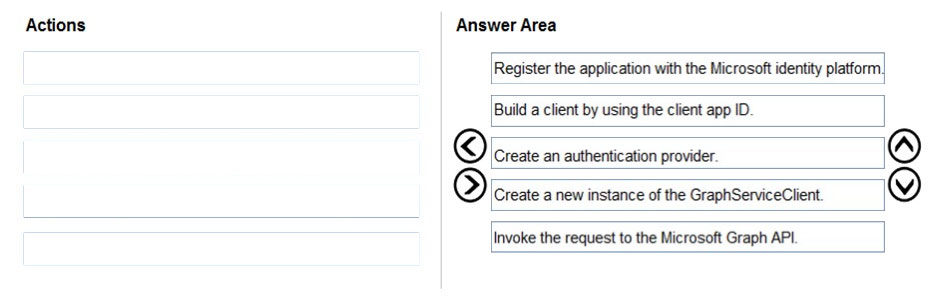
Step 1: Register the application with the Microsoft identity platform.
To authenticate with the Microsoft identity platform endpoint, you must first register your app at the Azure app registration portal
Step 2: Build a client by using the client app ID
Step 3: Create an authentication provider
Create an authentication provider by passing in a client application and graph scopes.
Code example:
DeviceCodeProvider authProvider = new DeviceCodeProvider(publicClientApplication, graphScopes);
// Create a new instance of GraphServiceClient with the authentication provider.
GraphServiceClient graphClient = new GraphServiceClient(authProvider);
Step 4: Create a new instance of the GraphServiceClient
Step 5: Invoke the request to the Microsoft Graph API
Reference:
https://docs.microsoft.com/en-us/graph/auth-v2-service
https://docs.microsoft.com/en-us/graph/sdks/create-client
Question #223
DRAG DROP -
You develop and deploy an Azure Logic App that calls an Azure Function app. The Azure Function App includes an OpenAPI (Swagger) definition and uses an
Azure Blob storage account. All resources are secured by using Azure Active Directory (Azure AD).
The Logic App must use Azure Monitor logs to record and store information about runtime data and events. The logs must be stored in the Azure Blob storage account.
You need to set up Azure Monitor logs and collect diagnostics data for the Azure Logic App.
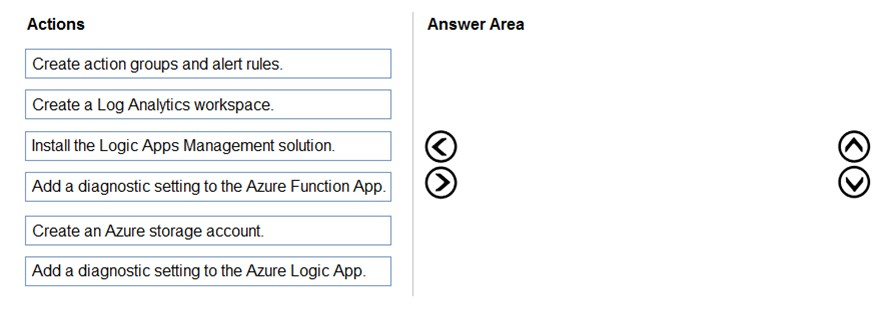
Which three actions should you perform in sequence? To answer, move the appropriate actions from the list of actions to the answer area and arrange them in the correct order.
Select and Place:
You develop and deploy an Azure Logic App that calls an Azure Function app. The Azure Function App includes an OpenAPI (Swagger) definition and uses an
Azure Blob storage account. All resources are secured by using Azure Active Directory (Azure AD).
The Logic App must use Azure Monitor logs to record and store information about runtime data and events. The logs must be stored in the Azure Blob storage account.
You need to set up Azure Monitor logs and collect diagnostics data for the Azure Logic App.
Which three actions should you perform in sequence? To answer, move the appropriate actions from the list of actions to the answer area and arrange them in the correct order.
Select and Place:
Correct Answer:
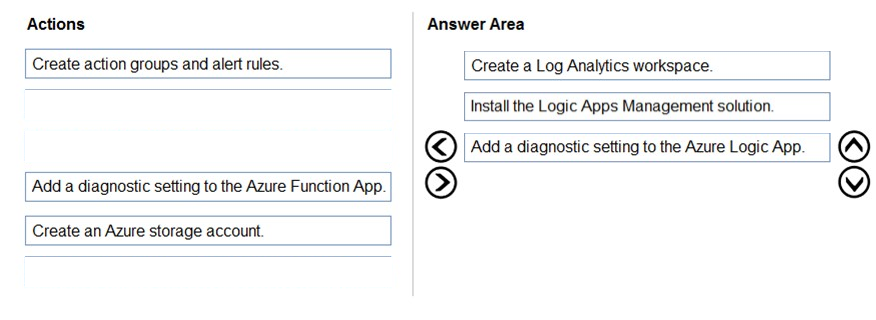
Step 1: Create a Log Analytics workspace
Before you start, you need a Log Analytics workspace.
Step 2: Install the Logic Apps Management solution
To set up logging for your logic app, you can enable Log Analytics when you create your logic app, or you can install the Logic Apps Management solution in your
Log Analytics workspace for existing logic apps.
Step 3: Add a diagnostic setting to the Azure Logic App
Set up Azure Monitor logs -
1. In the Azure portal, find and select your logic app.
2. On your logic app menu, under Monitoring, select Diagnostic settings > Add diagnostic setting.
Reference:
https://docs.microsoft.com/en-us/azure/logic-apps/monitor-logic-apps-log-analytics
Question #224
DRAG DROP -
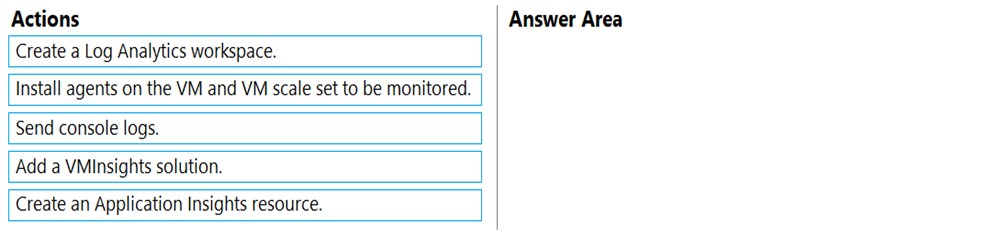
You develop an application. You plan to host the application on a set of virtual machines (VMs) in Azure.
You need to configure Azure Monitor to collect logs from the application.
Which four actions should you perform in sequence? To answer, move the appropriate actions from the list of actions to the answer area and arrange them in the correct order.
Select and Place:
Correct Answer:
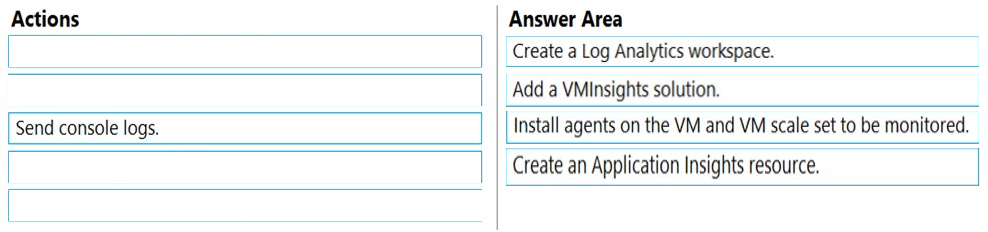
Step 1: Create a Log Analytics workspace.
First create the workspace.
Step 2: Add a VMInsights solution.
Before a Log Analytics workspace can be used with VM insights, it must have the VMInsights solution installed.
Step 3: Install agents on the VM and VM scale set to be monitored.
Prior to onboarding agents, you must create and configure a workspace. Install or update the Application Insights Agent as an extension for Azure virtual machines and VM scalet sets.
Step 4: Create an Application Insights resource
Sign in to the Azure portal, and create an Application Insights resource.
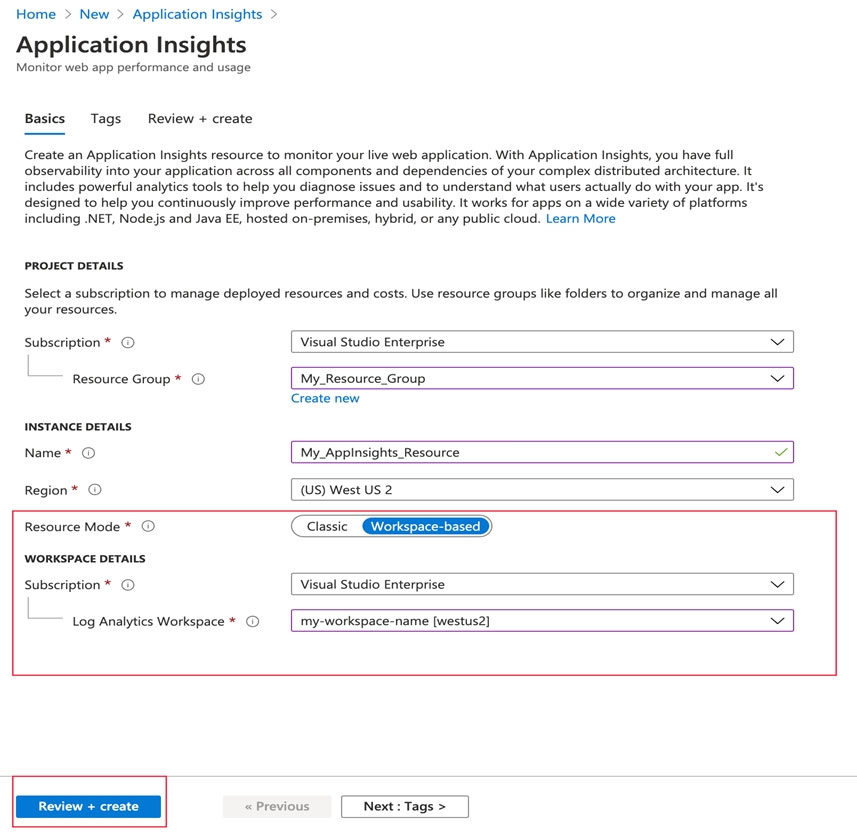
Once a workspace-based Application Insights resource has been created, configuring monitoring is relatively straightforward.
Reference:
https://docs.microsoft.com/en-us/azure/azure-monitor/vm/vminsights-configure-workspace https://docs.microsoft.com/en-us/azure/azure-monitor/app/create-workspace-resource
Step 1: Create a Log Analytics workspace.
First create the workspace.
Step 2: Add a VMInsights solution.
Before a Log Analytics workspace can be used with VM insights, it must have the VMInsights solution installed.
Step 3: Install agents on the VM and VM scale set to be monitored.
Prior to onboarding agents, you must create and configure a workspace. Install or update the Application Insights Agent as an extension for Azure virtual machines and VM scalet sets.
Step 4: Create an Application Insights resource
Sign in to the Azure portal, and create an Application Insights resource.
Once a workspace-based Application Insights resource has been created, configuring monitoring is relatively straightforward.
Reference:
https://docs.microsoft.com/en-us/azure/azure-monitor/vm/vminsights-configure-workspace https://docs.microsoft.com/en-us/azure/azure-monitor/app/create-workspace-resource
Question #225
You develop and deploy an Azure App Service web app. The app is deployed to multiple regions and uses Azure Traffic Manager. Application Insights is enabled for the app.
You need to analyze app uptime for each month.
Which two solutions will achieve the goal? Each correct answer presents a complete solution.
NOTE: Each correct selection is worth one point.
You need to analyze app uptime for each month.
Which two solutions will achieve the goal? Each correct answer presents a complete solution.
NOTE: Each correct selection is worth one point.
Question #226
DRAG DROP -
You develop and deploy an Azure App Service web app. The web app accesses data in an Azure SQL database.
You must update the web app to store frequently used data in a new Azure Cache for Redis Premium instance.
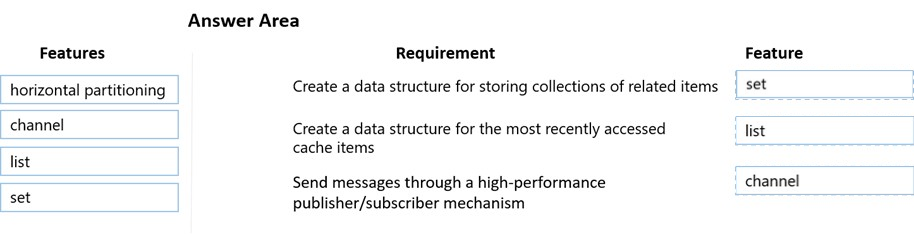
You need to implement the Azure Cache for Redis features.
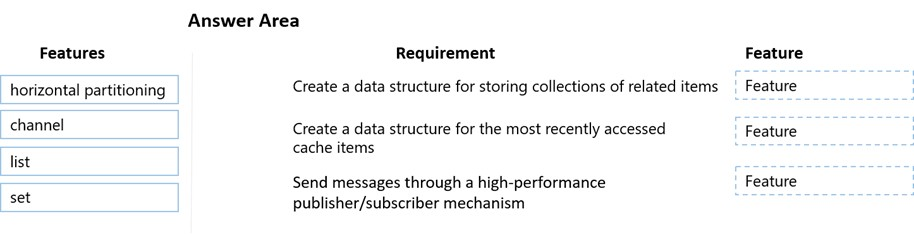
Which feature should you implement? To answer, drag the appropriate feature to the correct requirements. Each feature may be used once, more than once, or not at all. You may need to drag the split bar between panes or scroll to view content.
NOTE: Each correct selection is worth one point.
Select and Place:
You develop and deploy an Azure App Service web app. The web app accesses data in an Azure SQL database.
You must update the web app to store frequently used data in a new Azure Cache for Redis Premium instance.
You need to implement the Azure Cache for Redis features.
Which feature should you implement? To answer, drag the appropriate feature to the correct requirements. Each feature may be used once, more than once, or not at all. You may need to drag the split bar between panes or scroll to view content.
NOTE: Each correct selection is worth one point.
Select and Place:
Correct Answer:
Reference:
https://www.red-gate.com/simple-talk/development/dotnet-development/overview-of-azure-cache-for-redis/ https://docs.microsoft.com/en-us/azure/architecture/best-practices/caching
Reference:
https://www.red-gate.com/simple-talk/development/dotnet-development/overview-of-azure-cache-for-redis/ https://docs.microsoft.com/en-us/azure/architecture/best-practices/caching
Question #227
You are developing an ASP.NET Core Web API web service. The web service uses Azure Application Insights for all telemetry and dependency tracking. The web service reads and writes data to a database other than Microsoft SQL Server.
You need to ensure that dependency tracking works for calls to the third-party database.
Which two dependency telemetry properties should you use? Each correct answer presents part of the solution.
NOTE: Each correct selection is worth one point.
You need to ensure that dependency tracking works for calls to the third-party database.
Which two dependency telemetry properties should you use? Each correct answer presents part of the solution.
NOTE: Each correct selection is worth one point.
Question #228
HOTSPOT -
You are using Azure Front Door Service.
You are expecting inbound files to be compressed by using Brotli compression. You discover that inbound XML files are not compressed. The files are 9 megabytes (MB) in size.
You need to determine the root cause for the issue.
To answer, select the appropriate options in the answer area.
NOTE: Each correct selection is worth one point.
Hot Area:
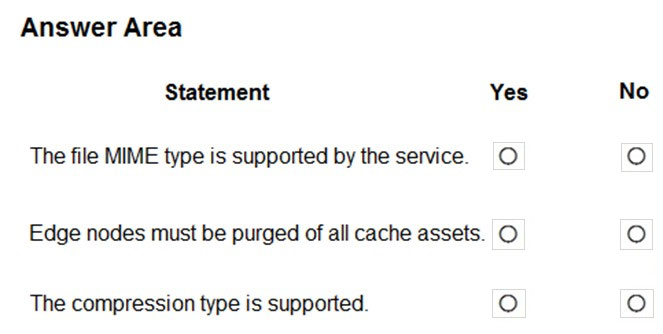
Correct Answer:
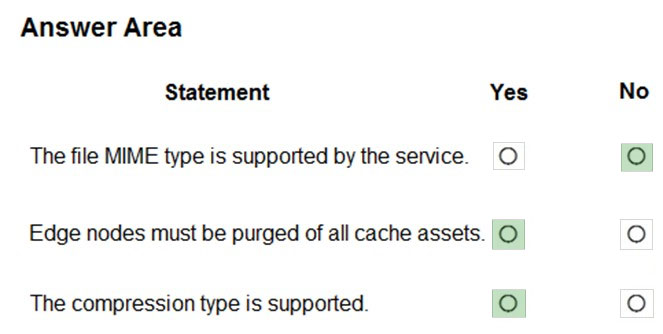
Box 1: No -
Front Door can dynamically compress content on the edge, resulting in a smaller and faster response to your clients. All files are eligible for compression.
However, a file must be of a MIME type that is eligible for compression list.
Box 2: No -
Sometimes you may wish to purge cached content from all edge nodes and force them all to retrieve new updated assets. This might be due to updates to your web application, or to quickly update assets that contain incorrect information.
Box 3: Yes -
These profiles support the following compression encodings: Gzip (GNU zip), Brotli
Reference:
https://docs.microsoft.com/en-us/azure/frontdoor/front-door-caching
Question #229
HOTSPOT -
You are developing an Azure App Service hosted ASP.NET Core web app to deliver video-on-demand streaming media. You enable an Azure Content Delivery
Network (CDN) Standard for the web endpoint. Customer videos are downloaded from the web app by using the following example URL: http://www.contoso.com/ content.mp4?quality=1.
All media content must expire from the cache after one hour. Customer videos with varying quality must be delivered to the closest regional point of presence
(POP) node.
You need to configure Azure CDN caching rules.
Which options should you use? To answer, select the appropriate options in the answer area.
NOTE: Each correct selection is worth one point.
Hot Area:
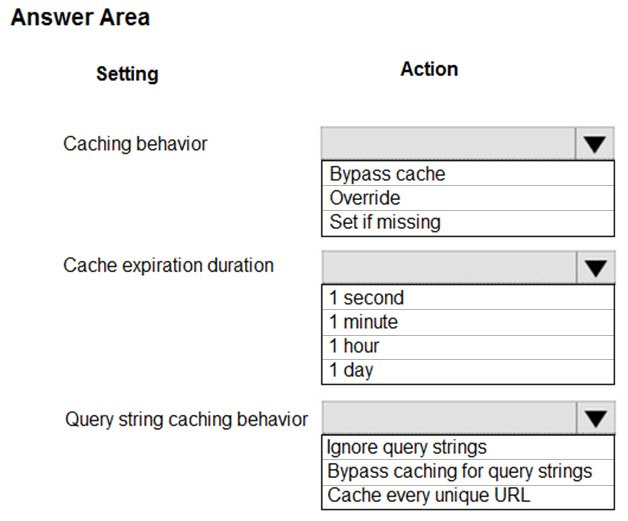
Correct Answer:
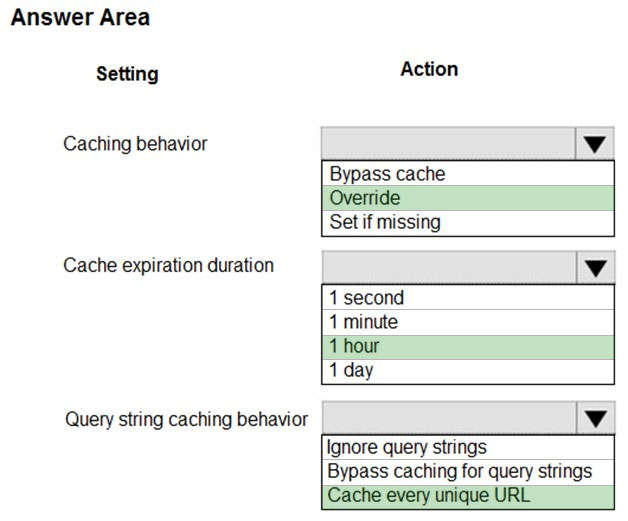
Box 1: Override -
Override: Ignore origin-provided cache duration; use the provided cache duration instead. This will not override cache-control: no-cache.
Set if missing: Honor origin-provided cache-directive headers, if they exist; otherwise, use the provided cache duration.
Incorrect:
Bypass cache: Do not cache and ignore origin-provided cache-directive headers.
Box 2: 1 hour -
All media content must expire from the cache after one hour.
Box 3: Cache every unique URL -
Cache every unique URL: In this mode, each request with a unique URL, including the query string, is treated as a unique asset with its own cache. For example, the response from the origin server for a request for example.ashx?q=test1 is cached at the POP node and returned for subsequent caches with the same query string. A request for example.ashx?q=test2 is cached as a separate asset with its own time-to-live setting.
Incorrect Answers:
Bypass caching for query strings: In this mode, requests with query strings are not cached at the CDN POP node. The POP node retrieves the asset directly from the origin server and passes it to the requestor with each request.
Ignore query strings: Default mode. In this mode, the CDN point-of-presence (POP) node passes the query strings from the requestor to the origin server on the first request and caches the asset. All subsequent requests for the asset that are served from the POP ignore the query strings until the cached asset expires.
Reference:
https://docs.microsoft.com/en-us/azure/cdn/cdn-query-string
Question #230
HOTSPOT -
You are developing an ASP.NET Core time sheet application that runs as an Azure Web App. Users of the application enter their time sheet information on the first day of every month.
The application uses a third-party web service to validate data.
The application encounters periodic server errors due to errors that result from calling a third-party web server. Each request to the third-party server has the same chance of failure.
You need to configure an Azure Monitor alert to detect server errors unrelated to the third-party service. You must minimize false-positive alerts.
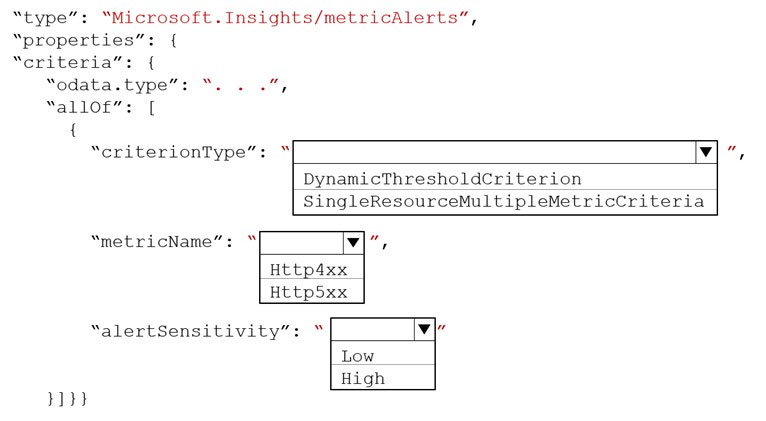
How should you complete the Azure Resource Manager template? To answer, select the appropriate options in the answer area.
NOTE: Each correct selection is worth one point.
Hot Area:
You are developing an ASP.NET Core time sheet application that runs as an Azure Web App. Users of the application enter their time sheet information on the first day of every month.
The application uses a third-party web service to validate data.
The application encounters periodic server errors due to errors that result from calling a third-party web server. Each request to the third-party server has the same chance of failure.
You need to configure an Azure Monitor alert to detect server errors unrelated to the third-party service. You must minimize false-positive alerts.
How should you complete the Azure Resource Manager template? To answer, select the appropriate options in the answer area.
NOTE: Each correct selection is worth one point.
Hot Area:
Correct Answer:
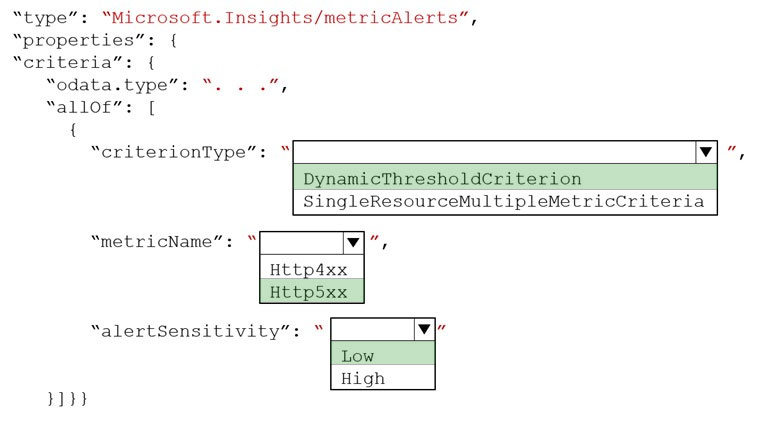
Box 1: DynamicThresholdCriterion
Box 2: Http5xx -
Server errors are in the 5xx range.
Client errors are in the 4xx range
Box 3: Low -
Reference:
https://docs.microsoft.com/en-us/azure/azure-monitor/alerts/alerts-dynamic-thresholds
Box 1: DynamicThresholdCriterion
Box 2: Http5xx -
Server errors are in the 5xx range.
Client errors are in the 4xx range
Box 3: Low -
Reference:
https://docs.microsoft.com/en-us/azure/azure-monitor/alerts/alerts-dynamic-thresholds
Question #231
You are developing a web application that uses Azure Cache for Redis. You anticipate that the cache will frequently fill and that you will need to evict keys.
You must configure Azure Cache for Redis based on the following predicted usage pattern: A small subset of elements will be accessed much more often than the rest.
You need to configure the Azure Cache for Redis to optimize performance for the predicted usage pattern.
Which two eviction policies will achieve the goal?
NOTE: Each correct selection is worth one point.
Question #232
DRAG DROP -
An organization has web apps hosted in Azure.
The organization wants to track events and telemetry data in the web apps by using Application Insights.
You need to configure the web apps for Application Insights.
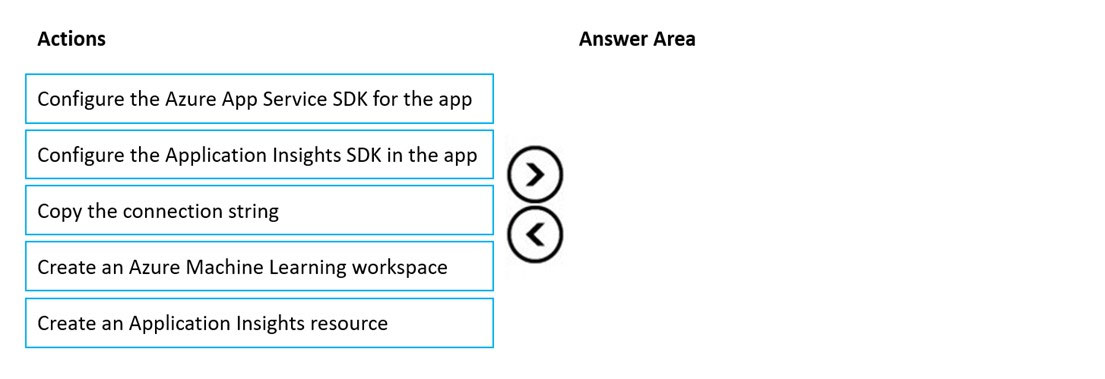
Which three actions should you perform in sequence? To answer, move the appropriate actions from the list of actions to the answer area and arrange them in the correct order.
Select and Place:
An organization has web apps hosted in Azure.
The organization wants to track events and telemetry data in the web apps by using Application Insights.
You need to configure the web apps for Application Insights.
Which three actions should you perform in sequence? To answer, move the appropriate actions from the list of actions to the answer area and arrange them in the correct order.
Select and Place:
Correct Answer:
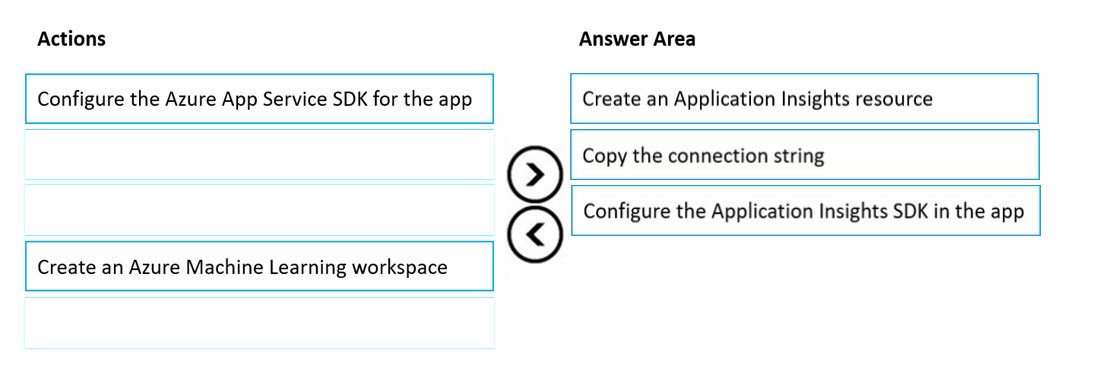
Step 1: Create an Application Insights resource
Creating an Application Insights workspace-based resource us a prerequisite.
Step 2: Copy the connection string
A connection string identifies the resource that you want to associate with your telemetry data. It also allows you to modify the endpoints that your resource will use as a destination for your telemetry. You'll need to copy the connection string and add it to your application's code or to an environment variable.
Step 3: Configure the Application Insights SDK in the app
The Application Insights SDK for ASP.NET Core can monitor your applications no matter where or how they run.
Install the Application Insights SDK NuGet package for ASP.NET Core.
Reference:
https://docs.microsoft.com/en-us/azure/azure-monitor/app/asp-net-core
Question #233
An organization hosts web apps in Azure. The organization uses Azure Monitor.
You discover that configuration changes were made to some of the web apps.
You need to identify the configuration changes.
Which Azure Monitor log should you review?
You discover that configuration changes were made to some of the web apps.
You need to identify the configuration changes.
Which Azure Monitor log should you review?
Question #234
You develop and deploy an Azure App Service web app to a production environment. You enable the Always On setting and the Application Insights site extensions.
You deploy a code update and receive multiple failed requests and exceptions in the web app.
You need to validate the performance and failure counts of the web app in near real time.
Which Application Insights tool should you use?
You deploy a code update and receive multiple failed requests and exceptions in the web app.
You need to validate the performance and failure counts of the web app in near real time.
Which Application Insights tool should you use?
- AProfiler
- BSmart Detection
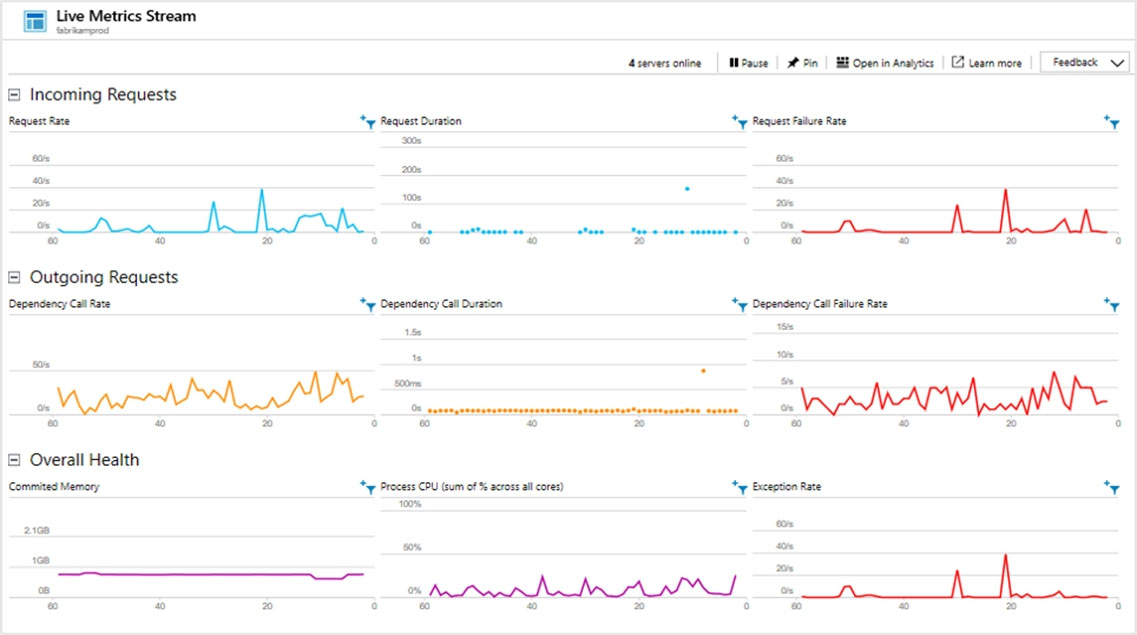
- CLive Metrics Stream
- DApplication Map
- ESnapshot Debugger
Correct Answer:
C
Live Metrics Stream -
Deploying the latest build can be an anxious experience. If there are any problems, you want to know about them right away, so that you can back out if necessary. Live Metrics Stream gives you key metrics with a latency of about one second.
With Live Metrics Stream, you can:
* Validate a fix while it's released, by watching performance and failure counts.
* Etc.
Incorrect:
* Profiler
Azure Application Insights Profiler provides performance traces for applications running in production in Azure. Profiler:
Captures the data automatically at scale without negatively affecting your users.
Helps you identify the ג€hotג€ code path spending the most time handling a particular web request.
* Snapshot debugger
When an exception occurs, you can automatically collect a debug snapshot from your live web application. The snapshot shows the state of source code and variables at the moment the exception was thrown. The Snapshot Debugger in Azure Application Insights monitors exception telemetry from your web app. It collects snapshots on your top-throwing exceptions so that you have the information you need to diagnose issues in production.
Reference:
https://docs.microsoft.com/en-us/azure/azure-monitor/app/live-stream
Question #235
HOTSPOT -
You deploy an ASP.NET web app to Azure App Service.
You must monitor the web app by using Application Insights.
You need to configure Application Insights to meet the requirements.
Which feature should you use? To answer, select the appropriate options in the answer area.
NOTE: Each correct selection is worth one point.
Hot Area:
Correct Answer:
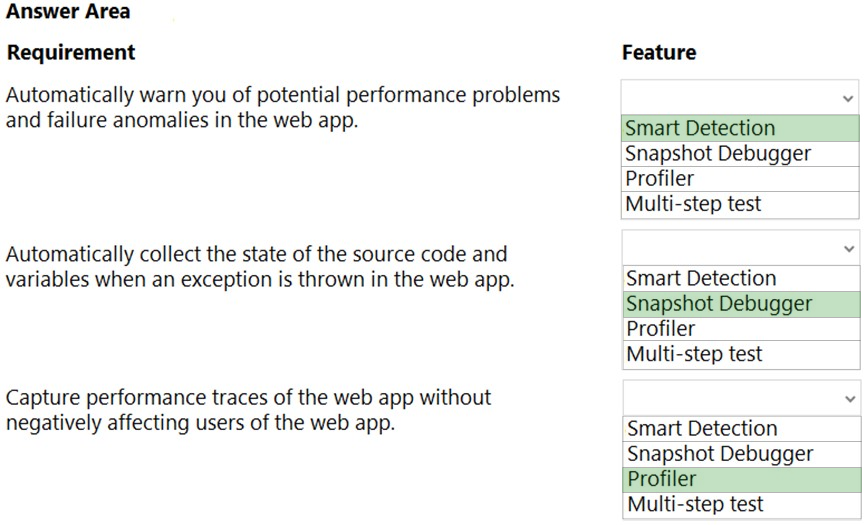
Box 1: Smart Detection -
Smart detection automatically warns you of potential performance problems and failure anomalies in your web application. It performs proactive analysis of the telemetry that your app sends to Application Insights. If there is a sudden rise in failure rates, or abnormal patterns in client or server performance, you get an alert. This feature needs no configuration. It operates if your application sends enough telemetry.
Box 2: Snapshot Debugger -
When an exception occurs, you can automatically collect a debug snapshot from your live web application. The snapshot shows the state of source code and variables at the moment the exception was thrown. The Snapshot Debugger in Azure Application Insights monitors exception telemetry from your web app. It collects snapshots on your top-throwing exceptions so that you have the information you need to diagnose issues in production.
Box 3: Profiler -
Azure Application Insights Profiler provides performance traces for applications running in production in Azure. Profiler:
Captures the data automatically at scale without negatively affecting your users.
Helps you identify the ג€hotג€ code path spending the most time handling a particular web request.
Reference:
https://docs.microsoft.com/en-us/azure/azure-monitor/app/proactive-diagnostics https://docs.microsoft.com/en-us/azure/azure-monitor/snapshot-debugger/snapshot-debugger https://docs.microsoft.com/en-us/azure/azure-monitor/profiler/profiler-overview
Question #236
You are building a web application that performs image analysis on user photos and returns metadata containing objects identified. The image analysis is very costly in terms of time and compute resources. You are planning to use Azure Redis Cache so duplicate uploads do not need to be reprocessed.
In case of an Azure data center outage, metadata loss must be kept to a minimum.
You need to configure the Azure Redis cache instance.
Which two actions should you perform? Each correct answer presents part of the solution.
NOTE: Each correct selection is worth one point.
In case of an Azure data center outage, metadata loss must be kept to a minimum.
You need to configure the Azure Redis cache instance.
Which two actions should you perform? Each correct answer presents part of the solution.
NOTE: Each correct selection is worth one point.
Question #237
You are developing an Azure-based web application. The application goes offline periodically to perform offline data processing. While the application is offline, numerous Azure Monitor alerts fire which result in the on-call developer being paged.
The application must always log when the application is offline for any reason.
You need to ensure that the on-call developer is not paged during offline processing.
What should you do?
The application must always log when the application is offline for any reason.
You need to ensure that the on-call developer is not paged during offline processing.
What should you do?
Question #238
Note: This question is part of a series of questions that present the same scenario. Each question in the series contains a unique solution that might meet the stated goals. Some question sets might have more than one correct solution, while others might not have a correct solution.
After you answer a question in this section, you will NOT be able to return to it. As a result, these questions will not appear in the review screen.
You are developing an Azure solution to collect point-of-sale (POS) device data from 2,000 stores located throughout the world. A single device can produce 2 megabytes (MB) of data every 24 hours. Each store location has one to five devices that send data.
You must store the device data in Azure Blob storage. Device data must be correlated based on a device identifier. Additional stores are expected to open in the future.
You need to implement a solution to receive the device data.
Solution: Provision an Azure Service Bus. Configure a topic to receive the device data by using a correlation filter.
Does the solution meet the goal?
Question #239
Note: This question is part of a series of questions that present the same scenario. Each question in the series contains a unique solution that might meet the stated goals. Some question sets might have more than one correct solution, while others might not have a correct solution.
After you answer a question in this section, you will NOT be able to return to it. As a result, these questions will not appear in the review screen.
You are developing an Azure solution to collect point-of-sale (POS) device data from 2,000 stores located throughout the world. A single device can produce 2 megabytes (MB) of data every 24 hours. Each store location has one to five devices that send data.
You must store the device data in Azure Blob storage. Device data must be correlated based on a device identifier. Additional stores are expected to open in the future.
You need to implement a solution to receive the device data.
Solution: Provision an Azure Event Grid. Configure event filtering to evaluate the device identifier.
Does the solution meet the goal?
Question #240
DRAG DROP -
You manage several existing Logic Apps.
You need to change definitions, add new logic, and optimize these apps on a regular basis.
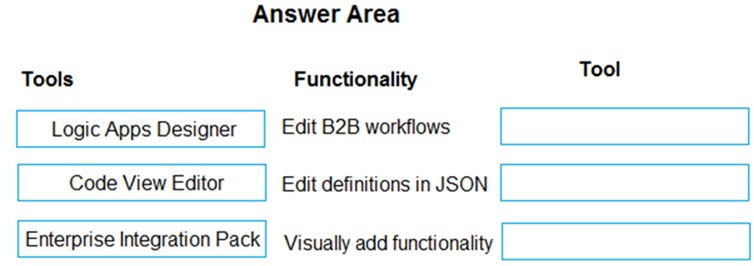
What should you use? To answer, drag the appropriate tools to the correct functionalities. Each tool may be used once, more than once, or not at all. You may need to drag the split bar between panes or scroll to view content.
NOTE: Each correct selection is worth one point.
Select and Place:
You manage several existing Logic Apps.
You need to change definitions, add new logic, and optimize these apps on a regular basis.
What should you use? To answer, drag the appropriate tools to the correct functionalities. Each tool may be used once, more than once, or not at all. You may need to drag the split bar between panes or scroll to view content.
NOTE: Each correct selection is worth one point.
Select and Place:
Correct Answer:
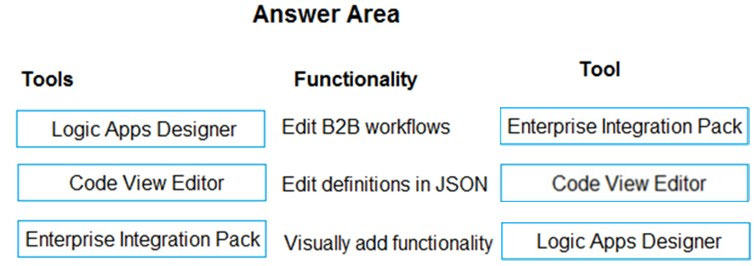
Box 1: Enterprise Integration Pack
For business-to-business (B2B) solutions and seamless communication between organizations, you can build automated scalable enterprise integration workflows by using the Enterprise Integration Pack (EIP) with Azure Logic Apps.
Box 2: Code View Editor -
Edit JSON - Azure portal -
1. Sign in to the Azure portal.
2. From the left menu, choose All services. In the search box, find "logic apps", and then from the results, select your logic app.
3. On your logic app's menu, under Development Tools, select Logic App Code View.
4. The Code View editor opens and shows your logic app definition in JSON format.
Box 3: Logic Apps Designer -
Reference:
https://docs.microsoft.com/en-us/azure/logic-apps/logic-apps-enterprise-integration-overview https://docs.microsoft.com/en-us/azure/logic-apps/logic-apps-author-definitions
No comments:
Post a Comment