Azure Security Center
Azure Security Center is a service that manages the security of your infrastructure from a centralized location. Use Security Center to monitor the security of your workloads, whether they’re on-premises or in the cloud. Security Center creates an agent on each supported virtual machine as it’s created. It then automatically starts collecting data from the machine. You use Security Center to reduce the complexity of configuring security in this way.
You use Security Center if:
- you want to identify and address risks and threats to your infrastructure.
- you don’t have the traditional in-house skills and capital needed to secure a complex infrastructure.
- you want to secure an infrastructure that consists of on-premises and cloud resources.
Azure Application Insights
You use Azure Application Insights to monitor and manage the performance of your applications. Application Insights automatically gathers information related to performance, errors, and exceptions in applications. You also use Application Insights to diagnose what has caused the problems that affect an application.
You use Application Insights if:
- You want to analyze and address issues and problems that affect your application’s health.
- You want to improve your application’s development lifecycle.
- You want to analyze users’ activities to help understand them better.
To integrate Application Insights with your applications, you set up an Application Insights resource in the Azure portal. You also install an instrumentation package in your application. The package will monitor your application and send log data to the Log Analytics workspace.
Azure Monitor
Azure Monitor is the service for collecting, combining, and analyzing data from different sources. All the application log data that Application Insights collects is stored in a workspace that Azure Monitor can access. You’ll then have a central location to monitor and analyze the health and performance of all your applications. Other services like Security Center also rely on Azure Monitor.
You use Azure Monitor if:
- You need a single solution to help you collect, analyze, and act on log data from both cloud and on-premises.
- You’re using services such as Azure Application Insights and Azure Security Center. Those services store their collected data in workspaces for Azure Monitor. You can then use Azure Monitor Log Analytics to interactively query the data.
Azure Monitor centralizes and combines your metrics and log data from different sources. In the following diagram, the left side shows the sources that Azure Monitor supports. The right side shows what Azure Monitor lets you do with the data collected from those sources. You can analyze data, respond to alerts, and visualize by using different tools.

Azure Sentinel
You use Azure Sentinel to collect data on the devices, users, infrastructure, and applications across your enterprise. Built-in threat intelligence for detection and investigation can help reduce false positives. Use Sentinel to proactively hunt for threats and anomalies, and respond by using orchestration and automation. You connect your data sources to Sentinel. These sources include Microsoft services such as Office 365 and Azure Advanced Threat Protection.
- Azure Incidents help you group and combine alerts that are related. You use incidents to reduce the noise generated because of the scale of the data. Incidents also help you to further investigate any anomalous activities or threats that have raised alerts.
- Use playbooks to automate your response to alerts in Sentinel. You configure playbooks by using Azure Logic Apps. Your playbook details the steps to take when an alert is triggered in Sentinel.
- Use hunting queries to look for threats across your enterprise before alerts are raised. Microsoft security researchers maintain built-in hunting queries that act as a base for you to build your own queries.
- Use notebooks to automate your investigations. Notebooks are playbooks that can consist of investigation or hunting steps that you reuse or share with others. Use Azure Notebooks for Azure Sentinel to develop and run your notebooks.
You use Azure Sentinel if:
- You want a detailed overview of your organization, potentially across multiple clouds and on-premises locations.
- You want to avoid reliance on complex and disparate tools.
- You want to use enterprise-grade AI, built by experts, to identify and handle threats across your organization.
You create an Azure Sentinel resource in the Azure portal. The process for creating this resource involves creating a Log Analytics workspace, and then adding it to Sentinel. When you’ve created a Sentinel resource, you need to connect data sources for your enterprise. Sentinel integrates with Microsoft solutions, including Azure Active Directory and Office 365, through connectors. It also comes with connectors for non-Microsoft solutions. Sentinel also has a REST API that allows you to connect to other data sources.
When you connect the data source, your logs will be synced to Sentinel. You’ll see a summary of the data that has been collected in the DATA RECEIVED graph for your connector. You’ll also see the different data types that have been collected for the source. For example, the Azure Active Directory connector collects sign-in logs and audit logs for you.
When your data sources have been connected, Sentinel begins to monitor your enterprise. You can configure alert rules to investigate anomalies and threats more intelligently. You can respond manually or by using playbooks for automated responses.
Use the Incidents pane to see details about your incidents, such as how many you’ve closed and how many remain open. You also use the pane to find out when an incident happened and to determine its severity.
Playbooks can help you automatically respond to threats in Sentinel. You create a new playbook through the Playbooks pane in your Sentinel dashboard. You add a new playbook by creating a logic app.
Metrics are numerical values that help you understand the health, operation, and performance of your VMs. You can choose a specific metric and see a graph of that metric in the Azure portal. To get a full set of metrics, you need to install two tools directly on the VM: the Azure Diagnostics extension and the Log Analytics agent. Both tools are available for Windows and Linux. The tools need a storage account to save the data that they collect. After you’ve installed the tools, you can access near real-time metric alerts.
Set up a VM with boot diagnostics
1 2 3 4 5 6 7 8 9 10 11 12 13 14 15 16 17 18 | # Create a storage account to store boot diagnostics.STORAGE=metricsstorage$RANDOMaz storage account create \ --name $STORAGE \ --sku Standard_LRS \ --location eastus2 \ --resource-group learn-bcca48c3-c733-4df2-be53-e37820fee295# Create VM with boot diagnostics enabled.az vm create \ --name monitored-linux-vm \ --image UbuntuLTS \ --size Standard_B1s \ --location eastus2 \ --admin-username azureuser \ --boot-diagnostics-storage $STORAGE \ --resource-group learn-bcca48c3-c733-4df2-be53-e37820fee295 \ --generate-ssh-keys |
Analyze your Azure infrastructure by using Azure Monitor logs – Learn | Microsoft Docs
Azure Monitor collects two fundamental types of data: metrics and logs. Metrics tell you how the resource is performing, and the other resources that it’s consuming. Logs contain records that show when resources are created or modified.
The Kusto query language that Azure Monitor uses is case-sensitive. Language keywords are typically written in lowercase. When you’re using names of tables or columns in a query, make sure to use the correct case.
Monitor the performance of virtual machines using Azure Monitor for VMs – Learn | Microsoft Docs
Azure Monitor Logs collects and organizes log data generated from Azure resources. Log data is stored in a Log Analytics workspace. Data living in the workspace can be queried for trend analysis, reporting, and alerting. Some examples of data captured include Windows event logs, Heartbeat logs, performance data, and syslogs. Azure Monitor for VMs is a feature of Azure Monitor that relies on Azure Monitor Logs. Think of Azure Monitor for VMs as a feature that provides a predefined, curated monitoring experience, with little configuration required. Azure Monitor for VMs uses a table named InsightsMetrics. Administrators can query performance and usage for virtual machines in near real time using that table. The data generated allows you to display everything in a meaningful way. Azure Monitor for VMs also allows administrators an ability to process log data without exposing the underlying queries.
There are a few different resources and services that complete the native monitoring toolkit in Azure. Azure Monitor becomes the service at the top, which spans across all monitoring tools with everything else lives underneath. The service collects and analyzes data generated from Azure resources. Azure Monitor captures monitoring data from the following sources:
- Application
- Guest OS
- Azure resources
- Azure subscriptions
- Azure tenant
Data collected by Azure Monitor is composed of metrics (Azure Monitor Metrics) and logs (Azure Monitor Logs). The major difference between Azure Monitor Metrics and Azure Monitor Logs is the structure of data generated. Azure Monitor Metrics only store numeric data using a specific structure. Azure Monitor Logs can store Azure Monitor Metric data and a variety of other data types, each using their own structure.
Compute resources in Azure require a number of agents to help collect monitoring data inside Log Analytics and Azure Monitor. Each agent allows customers to measure performance, responsiveness, and availability of guest operating systems and underlying workloads.
| Agent | Description | Notes |
|---|---|---|
| Log Analytics agent | Collects logs and performance data for virtual machines in Azure, other clouds, or on-premises. | Allows the onboarding of Azure Security Center and Azure Sentinel. The agent also works in conjunction with Azure Automation accounts to onboard Azure Update Management, Azure Automation State Configuration, along with Azure Automation Change Tracking and Inventory. |
| Azure diagnostics extension | Enables customers to receive additional data from guest operating systems and workloads living on compute resources. | Data primarily captured with this extension will be sent to Azure Monitor Metrics. If necessary, this data could also be sent to a third-party tool by using Azure Event Hubs, sent to Azure Storage for archival, or you could collect boot diagnostics, which helps with investigations for virtual machine boot issues. |
| Dependency agent | Collects discovered data about certain processes running on virtual machines. | Maps all dependencies between virtual machines and any external process dependencies. |
Several Azure services use Azure Monitor Logs to store data and use the Kusto Query Language (KQL) to extract data. Azure Security Center, Azure Sentinel, and Azure Monitor Application Insights all use Log Analytics workspaces to store and query logs. Azure Monitor Logs are based upon Azure Data Explorer. A Log Analytics workspace is the equivalent of a database inside the Azure Data Explorer service. In order to unlock the full range of possibilities with Azure Monitor Logs, you will need to use log queries. These queries help you obtain a deep understanding of data collected in Azure Monitor Logs.
Improve incident response with alerting on Azure – Learn | Microsoft Docs
Azure Monitor receives data from target resources like applications, operating systems, Azure resources, Azure subscriptions, and Azure tenants. The nature of the resource defines which data types are available. A data type will be a metric, a log, or both a metric and a log.
- The focus for metric-based data types is the numerical time-sensitive values that represent some aspect of the target resource.
- The focus for log-based data types is the querying of content data held in structured, record-based log files that are relevant to the target resource.

You’ll learn about the three signal types that you can use to monitor your environment:
- Metric alerts provide an alert trigger when a specified threshold is exceeded. For example, a metric alert can notify you when CPU usage is greater than 95 percent.
- Activity log alerts notify you when Azure resources change state. For example, an activity log alert can notify you when a resource is deleted.
- Log alerts are based on things written to log files. For example, a log alert can notify you when a web server has returned a number of 404 or 500 responses.
- The target resource to be used for the alert rule. It’s possible to assign multiple target resources to a single alert rule. The type of resource will define the available signal types.
Every alert or notification available in Azure Monitor is the product of a rule. Some of these rules are built into the Azure platform. You use alert rules to create custom alerts and notifications. No matter which target resource or data source you use, the composition of an alert rule remains the same.
- The signal type to be used to assess the rule. The signal type can be a metric, an activity log, or logs. There are others, but this module doesn’t cover them.
- The alert logic applied to the data that’s supplied via the signal type. The structure of the alert logic will change depending on the signal type.
- The action, like sending an email, sending an SMS message, or using a webhook.
- An action group, which typically contains a unique set of recipients for the action.
- An alert name and an alert description that should specify the alert’s purpose.
- The severity of the alert if the criteria or logic test evaluates true. The five severity levels are: 0:Critical, 1: Error, 2:Warning, 3:Informational, 4:Verbose
In Azure Monitor, you can use metric alerts to achieve regular threshold monitoring of Azure resources. Azure Monitor runs metric alert trigger conditions at regular intervals. When the evaluation is true, Azure Monitor sends a notification. Metric alerts are stateful, and Azure Monitor will send a notification only when the prerequisite conditions are met.
For metric alerts, there’s an additional factor to define: the condition type. It can be static or dynamic. You must define the type of statistical analysis to be used with either static or dynamic metric alerts. Example types are minimum, maximum, average, and total. Static metric alerts are based on simple static conditions and thresholds that you define. With static metrics, you specify the threshold that will be used to trigger the alert or notification.
Dynamic metric alerts use machine learning tools that Azure provides to automatically improve the accuracy of the thresholds defined by the initial rule. There’s no hard threshold in dynamic metrics. However, you’ll need to define two more parameters:
- The look-back period defines how many previous periods need to be evaluated. For example, if you set the look-back period to 3, then in the example used here, the assessed data range would be 30 minutes (three sets of 10 minutes).
- The number of violations expresses how many times the logic condition has to deviate from the expected behavior before the alert rule fires a notification. In this example, if you set the number of violations to two, the alert would be triggered after two deviations from the calculated threshold.
Until now, the assessed metric alerts have focused on a single target instance. Azure Monitor supports dimensions, which enable monitoring data to be supplied from multiple target instances.
You use dimensions to define one metric alert rule and have it applied to multiple related instances. For example, you can monitor CPU utilization across all the servers running your app. You can then receive an individual notification for each server instance when the rule conditions are triggered.
1 2 3 4 5 6 7 8 9 10 11 12 13 14 15 16 17 18 19 20 21 22 23 24 25 26 27 28 29 30 31 32 33 34 35 36 37 | # Use metric alerts to alert on performance issues in your Azure environment# Create the VMcat <<EOF > cloud-init.txt#cloud-configpackage_upgrade: truepackages:- stressruncmd:- sudo stress --cpu 1EOFaz vm create \ --resource-group learn-a5475175-31ce-4a94-a319-f41aef923b69 \ --name vm1 \ --image UbuntuLTS \ --custom-data cloud-init.txt \ --generate-ssh-keysVMID=$(az vm show \ --resource-group learn-a5475175-31ce-4a94-a319-f41aef923b69 \ --name vm1 \ --query id \ --output tsv)# create a new metric alert that will be triggered when the VM CPU is greater than 80 percent.az monitor metrics alert create \ -n "Cpu80PercentAlert" \ --resource-group learn-a5475175-31ce-4a94-a319-f41aef923b69 \ --scopes $VMID \ --condition "max percentage CPU > 80" \ --description "Virtual machine is running at or greater than 80% CPU utilization" \ --evaluation-frequency 1m \ --window-size 1m \ --severity 3# In the example, you set up an Ubuntu VM and configured it to stress test the CPU. You also created a metric rule to detect when the maximum CPU percentage exceeds 80 percent and 90 percent. It might take 10 minutes before you see the alerts show up in your portal. |
Use log alerts to alert on events in your application
Log alerts use log data to assess the rule logic and, if necessary, trigger an alert. This data can come from any Azure resource: server logs, application server logs, or application logs. By its nature, log data is historical. So usage is focused on analytics and trends. You use these types of logs to assess if any of your servers have exceeded their CPU utilization by a given threshold during the last 30 minutes. Or, you can evaluate response codes issued on your web application server in the last hour.
Log alerts behave in a slightly different way from other alert mechanisms. The first part of a log alert defines the log search rule. The rule defines how often it should run, the time period under evaluation, and the query to be run. When a log search evaluates as positive, an alert record is created and any associated actions are triggered.
Every log alert has an associated search rule. The composition of these rules is:
- Log query: The query that runs every time the alert rule fires.
- Time period: The time range for the query.
- Frequency: How often the query should run.
- Threshold: The trigger point for an alert to be created.
Log search results are one of two types: number of records or metric measurement.
- Number of records: Consider using the number-of-records type of log search when you’re working with an event or event-driven data. Examples are syslog and web app responses.
- Metric measurement: Metric measurement logs offer the same basic functionality as metric alert logs. Unlike number-of-records search logs, metric measurement logs require additional criteria to be set:
- Aggregate function: The calculation that will be made against the result data. An example is count or average. The result of the function is called AggregatedValue.
- Group field: A field by which the result will be grouped. This criterion is used in conjunction with the aggregated value. For example, you might specify that you want the average grouped by computer.
- Interval: The time interval by which data is aggregated. For example, if you specify 10 minutes, an alert record is created for each aggregated block of 10 minutes.
- Threshold: A point defined by an aggregated value and the total number of breaches.
Activity log alerts
Activity log alerts enable you to be notified when a specific event happens on some Azure resource. For example, you can be notified when someone creates a new VM in a subscription. An activity log can also include alerts for Azure service health. A company can be notified when service issues or planned maintenance happens on the Azure platform.
So far, you’ve seen two different types of alerts supported in Azure Monitor. Metric alerts are ideally suited to monitoring for threshold breaches or spotting trends. Log alerts allow for greater analytical monitoring of historical data.
Activity log alerts are designed to work with Azure resources. Typically, you create this type of log to receive notifications when specific changes occur on a resource within your Azure subscription.
There are two types of activity log alerts:
- Specific operations: Apply to resources within your Azure subscription, and often have a scope with specific resources or a resource group. You use this type when you need to receive an alert that reports a change to an aspect of your subscription. For example, you can receive an alert if a VM is deleted or new roles are assigned to a user.
- Service health events: Include notice of incidents and maintenance of target resources.
It’s important to note that activity log alerts will monitor events only in the subscription where the log alert was created. Activity log alerts are based on events. The best approach for defining them is to use Azure Monitor to filter all the events in your subscription – until you find the one that you want. To begin the creation process, you then select Add activity log alert.
What are smart groups?
Smart groups are an automatic feature of Azure Monitor. By using machine learning algorithms, Azure Monitor joins alerts based on repeat occurrence or similarity. Smart groups enable you to address a group of alerts instead of each alert individually. The name of the smart group (its taxonomy), is assigned automatically, and is the name of the first alert in the group. It’s important to assign meaningful names to each alert that you create, because the name of the smart group can’t be changed or amended.
Think of smart groups as a dynamic filter applied to all the alerts in Azure Monitor. The machine learning algorithm in Azure Monitor joins alerts based on information, such as historical patterns, similar properties, or structure. Using smart groups can reduce alert noise by more than 90 percent. The power of smart groups is that they show you all related alerts and give improved analytics. They can often identify a previously unseen root cause.
Smart groups, like regular alerts, have their own state. The state shows the progress of the smart group in the resolution process. Changing the state of a smart group doesn’t alter the state of the individual alerts.
To change the state, select Change smart group state.
The states are:
- New: The smart group has been created with a collection of alerts, but it hasn’t yet been addressed.
- Acknowledged: When an admin starts the resolution process, they change the state to this.
- Closed: When the source of the alert is fixed, the admin changes the state to this.
Capture Web Application Logs with App Service Diagnostics Logging – Learn | Microsoft Docs
What are app logs?
App logs are the output of runtime trace statements in app code. For example, you might want to check some logic in your code by adding a trace to show when a particular function is being processed, or you might only want to see a logged message when a particular level of error has occurred.
- ASP.NET apps only run on Windows app services. To log information to the app diagnostics log, use the System.Diagnostics.Trace class.
- ASP.NET Core apps can run on either Windows or Linux. To log information to Azure app logs, use the logger factory class, and then use one of six-log levels:
- For script-based Web apps, such as Node.js apps on Windows or Linux, app logging is enabled using the console() method:
| App environment | Host | Log levels | Save location |
|---|---|---|---|
| ASP.NET | Windows | Error, Warning, Information, Verbose | File system, Blob storage |
| ASP.NET | Windows | Error, Warning, Information, Verbose | File system, Blob storage |
| ASP.NET | Linux | Error | File system |
| Node.js | Windows | Error (STDERR), Information (STDOUT), Warning, Verbose | File system, Blob storage |
| Node.js | Linux | Error | File System |
| Java | Linux | Error | File System |
Alternatives to app diagnostics
Azure Application Insights is a site extension that provides additional performance monitoring features, such as detailed usage and performance data, and is designed for production app deployments as well as being a potentially useful development tool. Application Insights works with a range of app development environments, providing the same set of rich telemetry and performance data whether the app is ASP.NET or Node. However, to make use of Application Insights, you have to include specific code within your app, using the App Insights SDK. Application Insights is also a billable service, so depending on the scale of your app deployments and data collected, you may need to plan for regular costs.
You can also view Metrics for your app, which can help you profile how your app is operating, and these counters are useful in production, as well as, development. You can view CPU, memory, network, and file system usage, and set up alerts when a counter hits a particular threshold. Billing for metrics is covered by the app service plan tier.
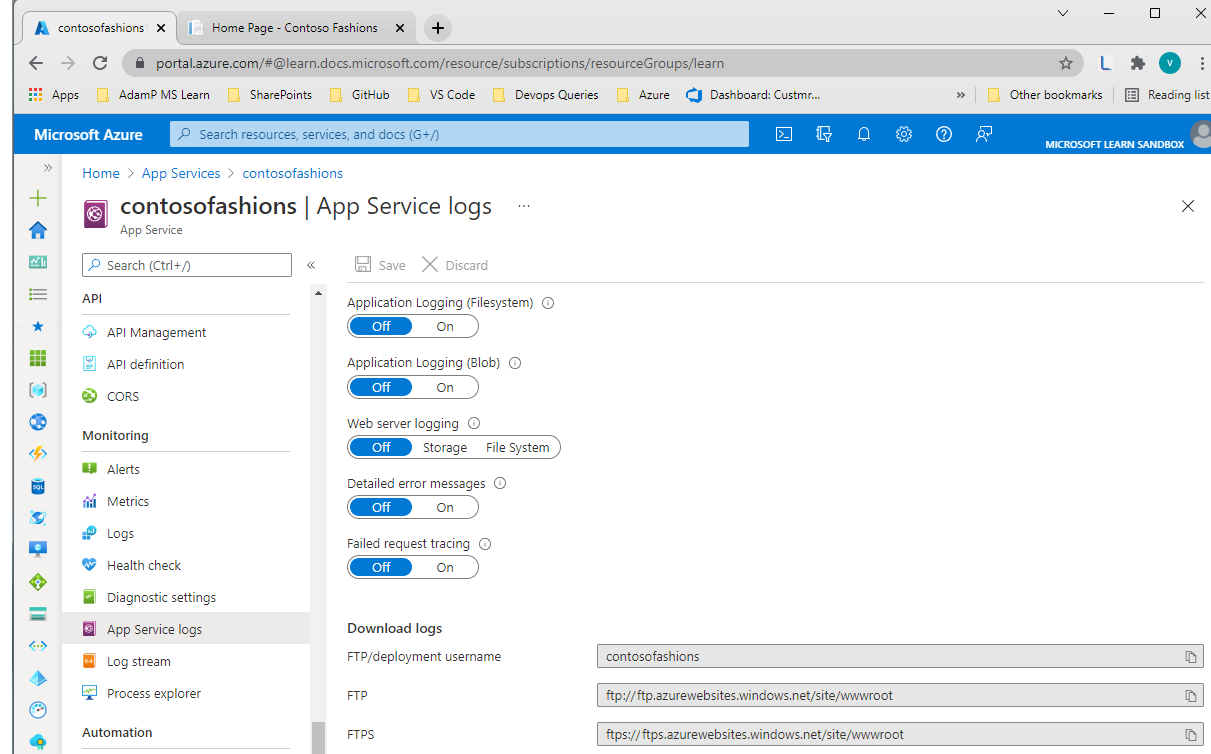
In the portal, app logging is managed from the Diagnostics logs pane of the web app. To enable app logging to the Web app’s file system, set Application logging (Filesystem) to On, and then set the Level to Error, Warning, Information, or Verbose. Logging to the file system will be automatically reset to Off after 12 hours. To enable app logging to a blob storage container, set Application logging (Blob) to On, and then select a storage account and container; the storage account and Web app must be created in the same Azure region. You then set the Level to Error, Warning, Information, or Verbose.
Saving to blob storage is not available for Linux app logs.
When logging to blob storage, you must also set a Retention Period. Unlike the file system logs, blob logs are never deleted by default; the retention period option means that any logs older than the specified number of days will be deleted.
1 2 3 4 5 6 7 8 9 10 11 12 13 14 15 16 | # Enable and Configure App Service Application Logging using the Azure Portal# Use Azure CLI to deploy a web appgitRepo=https://github.com/MicrosoftDocs/mslearn-capture-application-logs-app-serviceappName="contosofashions$RANDOM"appPlan="contosofashionsAppPlan"appLocation=eastusresourceGroup=learn-f7da5f3c-da42-45bf-b993-5d2dab36daf9storageAccount=sa$appName# deploy the web appaz appservice plan create --name $appPlan --resource-group $resourceGroup --location $appLocation --sku FREEaz webapp create --name $appName --resource-group $resourceGroup --plan $appPlan --deployment-source-url $gitRepo# Make a note of the random number suffix in your app name; this was generated to uniquely identify your app. The app may take several minutes to deploy.# create a storage accountaz storage account create -n $storageAccount -g $resourceGroup -l $appLocation --sku Standard_LRS |
What is live log streaming
Live log streaming is an easy and efficient way to view live logs for troubleshooting purposes. Live log streaming is designed to provide a quick view of all messages that are being sent to the app logs in the file system, without having to go through the process of locating and opening these logs. To use live logging, you connect to the live log service from the command line, and can then see text being written to the app’s logs in real time.
What logs can be streamed
The log streaming service adds a redirect from the file system logs, so you’ll see the same information as is saved to those log files. So, if you enable verbose logging for ASP.NET Windows apps, for example, the live log stream will show all your logged messages.
What logs can be streamed
The log streaming service adds a redirect from the file system logs, so you’ll see the same information as is saved to those log files. So, if you enable verbose logging for ASP.NET Windows apps, for example, the live log stream will show all your logged messages. The live log stream connects to only one app instance, so is not useful if you have a multi-instance app. Live logging is also of limited use as you scale up your apps; in these scenarios, it is better to ensure that messages are saved to log files that can be opened and studied offline.
1 2 | # Use Azure CLI to view the live log streamaz webapp log tail --resource-group learn-f7da5f3c-da42-45bf-b993-5d2dab36daf9 --name contosofashions<your-number> |
The Azure infrastructure used to run Windows Web apps is not the same as that for Linux apps, and log files are not stored in the same locations.
Windows app log files
For Windows apps, file system log files are stored in a virtual drive that is associated with your Web app. This drive is addressable as D:\Home, and includes a LogFiles folder; within this folder are one or more subfolders For Linux Web apps, the Azure tools currently support fewer logging options than for Windows apps. Redirections to STDERR and STDOUT are managed through the underlying Docker container that runs the app, and these messages are stored in Docker log files. To see messages logged by underlying processes, such as Apache, you will need to open an SSH connection to the Docker container.
Kudu
All Azure Web apps have an associated Source Control Management (SCM) service site. This site runs the Kudu service, and other Site Extensions; it is Kudu that manages deployment and troubleshooting for Azure Web Apps, including options for viewing and downloading log files. The specific functionality available in KUDU, and how you download logs, depends on the type of Web app. For Windows apps you can browse to the log file location, and then download the logs; for Linux apps, there may be a download link. One way to access the KUDU console is navigate to https://.scm.azurewebsites.net, and then sign in using deployment credentials. You can also access KUDU from the Azure portal. On the app pane, in the Development Tools section, select Advanced Tools, and then on the Advanced Tools pane, to open a new Kudu Services tab, select Go.
Retrieve file system logs using Azure CLI
1 | az webapp log download --log-file contosofashions.zip --resource-group learn-f7da5f3c-da42-45bf-b993-5d2dab36daf9 --name contosofashions<your-number> |
What is Application Insights?
Application Insights is an Azure service that helps you to monitor the performance and behavior of web applications.It mostly captures two kinds of data: events and metrics. Events are individual data points that can represent any kind of event that occurs in an app. These events can be technical events that occur within the application runtime or those that are related to the business domain of the application or actions taken by users. Metrics are measurements of values, typically taken at regular intervals, that aren’t tied to specific events. Like events, metrics can be related to the application’s runtime or infrastructure (like the length of a queue) or related to the application’s business domain or users (like how many videos are viewed in an hour).
Application Insights is represented in Azure as a resource deployed to one of your subscriptions. Each Application Insights resource you create is a repository for application telemetry data. It includes the various displays and configuration tools that you can view from the Azure portal. To send telemetry data to an Application Insights resource from an app, you need to configure the app with the instrumentation key of the Application Insights resource. After the resource starts to receive telemetry data, you can use the Azure portal to explore and analyze it. There are two ways to configure your app to send data to Application Insights:
- Runtime instrumentation: Runtime instrumentation captures telemetry without requiring you to change the web app’s source code. You can quickly enable this turnkey solution from the Azure portal when you first create your web app or anytime afterwards. Use this method when you want to set up Application Insights without involving developers or when code management policies prevent you from changing the app’s source code. Note that some advanced data displays aren’t available when you use only runtime instrumentation.
- Build-time instrumentation. With this method, developers add a server-side SDK to the web app’s code. For example, in an ASP.NET Core app, a developer could reference a NuGet package to access the SDK. When you instrument your app with the Application Insights SDK, you can enable full functionality and the richest set of visualizations in Application Insights. This type of instrumentation also enables you to add custom events and telemetry to your code to monitor unusual or unique behavior.
Runtime instrumentation and automatic client-side instrumentation is supported only on Windows web apps. These features rely on capabilities of IIS, the web server technology that powers Windows apps on App Service. The use of Application Insights in Linux apps is fully supported, but you need to modify application code to reference the Application Insights SDK. To automatically inject the JavaScript SDK and necessary configuration into pages served by your web app, add a new application setting named APPINSIGHTS_JAVASCRIPT_ENABLED and set the value to true.
Tools for data visualization
- The Azure portal. You can find a variety of tools by going to the Application Insights resource in the portal. These tools include a set of common performance charts on the Overview page, an Application map, and Performance and Failures pages. There’s also an Application Insights dashboard that contains a common set of charts. You can use the Metrics page to design new charts and add them to dashboards.
- Power BI. This tool is often used by business analysts to investigate business values like sales and profit margins. You can connect Power BI to an Application Insights resource and use it to display web app telemetry data.
- Visual Studio. Developers can connect Visual Studio to Application Insights to view the same charts and visualizations that are shown in the Azure portal. It’s convenient to see code and performance data in one tool.
- Custom tools. Application Insights includes a comprehensive API for accessing telemetry and analytics. Custom tools and applications can use the API to power their own visualizations. For example, if you have a custom mobile app that your business decision makers use to view sales data, you can add a visualization of web site performance statistics to the app.
The Application Insights resource is separate from the App Service resource that contains the instrumented web app. In the Azure portal, you can see both resources on the All resources pane and select them to see their details or make configuration changes. When you enable runtime instrumentation in a web app, a link appears in the Azure portal that takes you from the web app resource to the Application Insights resource that receives the data. From the web app, you can go to the Application Insights page and select View Application Insights data to go to the Application Insights resource and make configuration changes. From there, select Application Dashboard on the Overview page to see the dashboard for that resource.
Protect your virtual machines by using Azure Backup – Learn | Microsoft Docs
Azure Backup versus Azure Site Recovery
Both Backup and Site Recovery aim to make the system more resilient to faults and failures. However, while the primary goal of backup is to maintain copies of stateful data that allow you to go back in time, site-recovery replicates the data in almost real time and allows for a failover. In that sense, if there are issues like network or power outages, you can use availability zones. For a region-wide disaster (such as natural disasters), Site Recovery is used. Backups are used in cases of accidental data loss, data corruption, or ransomware attacks. Additionally, the choice of a recovery approach depends on the criticality of the application, RPO and RTO requirements, and the cost implications.
Why use Azure Backup?
- Zero-infrastructure backup: Azure Backup eliminates the need to deploy and manage any backup infrastructure or storage. This means there’s no overhead in maintaining backup servers or scaling the storage up or down as the needs vary.
- Long-term retention: Meet rigorous compliance and audit needs by retaining backups for many years, beyond which the recovery points will be pruned automatically by the built-in lifecycle management capability.
- Security: Azure Backup provides security to your backup environment – both when your data is in transit and at rest.
- azure role-based access control: rbac allows you to segregate duties within your team and grant only the amount of access to users necessary to do their jobs.
- encryption of backups: backup data is automatically encrypted using microsoft-managed keys. alternatively, you can also encrypt your backed-up data using customer-managed keys stored in the azure key vault.
- no internet connectivity required: when using azure vms, all the data transfer happens only on the azure backbone network without needing to access your virtual network. so no access to any ips or fqdns is required.
- soft delete: with soft delete, the backup data is retained for 14 additional days even after the deletion of the backup item. this protects against accidental deletion or malicious deletion scenarios, allowing the recovery of those backups with no data loss.
- Azure Backup also offers the ability to back up virtual machines encrypted with Azure Disk Encryption.
- High availability: Azure Backup offers three types of replication – LRS, GRS, and RA-GRS (to enable customer-controlled cross region restore) to keep your backup data highly available.
- Centralized monitoring and management: Azure Backup provides built-in monitoring and alerting capabilities in a Recovery Services vault. These capabilities are available without any additional management infrastructure.
About DPM/MABS
System Center DPM is an enterprise solution that configures, facilitates, and manages backup and recovery of enterprise machines and data. It’s part of the System Center suite of products. MABS is a server product that can be used to back up on-premises physical servers, VMs, and apps running on them. MABS is based on System Center DPM and provides similar functionality with a few differences:
- No System Center license is required to run MABS.
- For both MABS and DPM, Azure provides long-term backup storage. In addition, DPM allows you to back up data for long-term storage on tape. MABS doesn’t provide this functionality.
- You can back up a primary DPM server with a secondary DPM server. The secondary server will protect the primary server database and the data source replicas stored on the primary server. If the primary server fails, the secondary server can continue to protect workloads that are protected by the primary server, until the primary server is available again. MABS doesn’t provide this functionality.
Azure Backup supported scenarios
- Azure VMs – Back up Windows or Linux Azure virtual machines
- Azure Backup provides independent and isolated backups to guard against unintended destruction of the data on your VMs. Backups are stored in a Recovery Services vault with built-in management of recovery points. Configuration and scaling are simple, backups are optimized, and you can easily restore as needed.
- On-premises – Back up files, folders, and system state using the Microsoft Azure Recovery Services (MARS) agent . Or use Microsoft Azure Backup Server (MABS) or Data Protection Manager (DPM) server to protect on-premises VMs (Hyper-V and VMWare) and other on-premises workloads.
- Azure Files shares – Azure Files – Snapshot management by Azure Backup
- SQL Server in Azure VMs and SAP HANA databases in Azure VMs – Azure Backup offers stream-based, specialized solutions to back up SQL Server or SAP HANA running in Azure VMs. These solutions take workload-aware backups that support different backup types such as full, differential and log, 15-minute RPO, and point-in-time recovery.
How does Azure Backup work?
You can back up machines and data by using a number of methods:
- Back up on-premises machines:
- You can back up on-premises Windows machines directly to Azure by using the Azure Backup Microsoft Azure Recovery Services (MARS) agent. Linux machines aren’t supported.
- You can back up on-premises machines to a backup server – either System Center Data Protection Manager (DPM) or Microsoft Azure Backup Server (MABS). You can then back up the backup server to a Recovery Services vault in Azure.
- Back up Azure VMs:
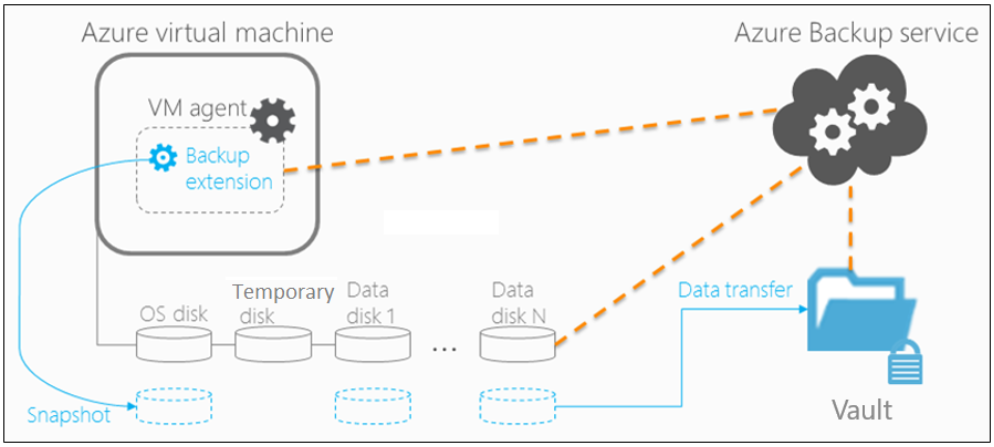
- You can back up Azure VMs directly. Azure Backup installs a backup extension to the Azure VM agent that’s running on the VM. This extension backs up the entire VM.
- You can back up specific files and folders on the Azure VM by running the MARS agent.
- You can back up Azure VMs to the MABS that’s running in Azure, and you can then back up the MABS to a Recovery Services vault.
Azure VMs are backed up by taking snapshots of the underlying disks at user-defined intervals and transferring those snapshots to the Recovery Services Vault as per the customer-defined policy.
Recovery Services vault
Azure Backup uses a Recovery Services vault to manage and store the backup data. A vault is a storage-management entity, which provides a simple experience to carry out and monitor backup and restore operations. With Azure Backup, you need not worry about deploying or managing storage accounts. In fact, all you need to specify is the vault you want to back up the VM to. The backup data is transferred to the Azure Backup storage accounts (in a separate fault domain) in the background. The vault also acts as an RBAC boundary to allow secure access to the data.
Snapshots
A snapshot is a point-in-time backup of all disks on the virtual machine. For Azure virtual machines, Azure Backup uses different extensions for each supporting operating system:
| Extension | OS | Description |
|---|---|---|
| VMSnapshot | Windows | The extension works with Volume Shadow Copy Service (VSS) to take a copy of the data on disk and in memory. |
| VMSnapshotLinux | Linux | The snapshot is a copy of the disk. |
Depending on how the snapshot is taken and what it includes, you can achieve different levels of consistency:
- Application consistent:
- The snapshot captures the virtual machine as a whole. It uses VSS writers to capture the content of the machine memory and any pending I/O operations.
- For Linux machines, you’ll need to write custom pre or post scripts per app to capture the application state.
- You can get complete consistency for the virtual machine and all running applications.
- File system consistent:
- If VSS fails on Windows, or the pre and post scripts fail on Linux, Azure Backup will still create a file-system-consistent snapshot.
- During a recovery, no corruption occurs within the machine. But installed applications need to do their own cleanup during startup to become consistent.
- Crash consistent:
- This level of consistency typically occurs if the virtual machine is shut down at the time of the backup.
- No I/O operations or memory contents are captured during this type of backup. This method doesn’t guarantee data consistency for the OS or app.
Backup Policy
- VM backup can be triggered daily or weekly, and can be stored for multiple years. The backup policy supports two access tiers – snapshot tier and the vault tier.
- Snapshot tier: All the snapshots are stored locally for a maximum period of five days. This is referred to as the snapshot tier. For all types of operation recoveries, it’s recommended that you restore from the snapshots since it’s much faster to do so. This capability is called Instant Restore.
- Vault tier: All snapshots are additionally transferred to the vault for additional security and longer retention. At this point, the recovery point type changes to “snapshot and vault”.
Backup process for an Azure virtual machine
- For Azure VMs that are selected for backup, Azure Backup starts a backup job according to the backup frequency you specify in the backup policy.
- During the first backup, a backup extension is installed on the VM, if the VM is running.
- For Windows VMs, the VMSnapshot extension is installed.
- For Linux VMs, the VMSnapshotLinux extension is installed.
- After the snapshot is taken, it’s stored locally as well transferred to the vault.
- The backup is optimized by backing up each VM disk in parallel.
- For each disk that’s being backed up, Azure Backup reads the blocks on the disk and identifies and transfers only the data blocks that changed (the delta) since the previous backup.
- Snapshot data might not be immediately copied to the vault. It might take several hours at peak times. Total backup time for a VM will be less than 24 hours for daily backup policies.
Create a backup for Azure virtual machines
1 2 3 4 5 6 7 8 9 10 11 12 13 14 15 16 17 18 19 20 21 22 23 24 25 26 27 28 29 30 31 32 33 34 35 36 37 38 39 40 41 42 43 44 45 46 47 48 49 | # Create a resource groupRGROUP=$(az group create --name vmbackups --location westus2 --output tsv --query name)# Use Cloud Shell to create the NorthwindInternal virtual network and the NorthwindInternal1 subnet.az network vnet create \ --resource-group $RGROUP \ --name NorthwindInternal \ --address-prefix 10.0.0.0/16 \ --subnet-name NorthwindInternal1 \ --subnet-prefix 10.0.0.0/24# Create a Windows virtual machineaz vm create \ --resource-group $RGROUP \ --name NW-APP01 \ --size Standard_DS1_v2 \ --vnet-name NorthwindInternal \ --subnet NorthwindInternal1 \ --image Win2016Datacenter \ --admin-username admin123 \ --no-wait \ --admin-password <password># Create a Linux virtual machineaz vm create \ --resource-group $RGROUP \ --name NW-RHEL01 \ --size Standard_DS1_v2 \ --image RedHat:RHEL:7-RAW:latest \ --authentication-type ssh \ --generate-ssh-keys \ --vnet-name NorthwindInternal \ --subnet NorthwindInternal1# use the following information to create a backup via Azure portal:# Recovery Services vault - Select Create new, and enter azure-backup for the name.# Resource group - Select the vmbackups resource group that you created earlier.# Choose a backup policy - Select (new) DailyPolicy, which is a daily backup at 12:00 PM UTC, and a retention range of 180 days.# Enable a backup by using the Azure CLIaz backup protection enable-for-vm \ --resource-group vmbackups \ --vault-name azure-backup \ --vm NW-APP01 \ --policy-name DefaultPolicyaz backup job list \ --resource-group vmbackups \ --vault-name azure-backup \ --output table |
Restore Types
| Restore Option | Details |
|---|---|
| Create a new VM | Quickly creates and gets a basic VM up and running from a restore point. The new VM must be created in the same region as the source VM. |
| Restore disk | Restores a VM disk, which can then be used to create a new VM. The disks are copied to the Resource Group you specify. Azure Backup provides a template to help you customize and create a VM. Alternatively, you can attach the disk to an existing VM, or create a new VM. This option is useful if you want to customize the VM, add configuration settings that weren’t there at the time of backup, or add settings that must be configured using the template or PowerShell. |
| Replace existing | You can restore a disk and use it to replace a disk on the existing VM. Azure Backup takes a snapshot of the existing VM before replacing the disk and stores it in the staging location you specify. Existing disks connected to the VM are replaced with the selected restore point. The current VM must exist. If it’s been deleted, this option can’t be used. |
| Cross Region (secondary region) | Cross Region restore can be used to restore Azure VMs in the secondary region, which is an Azure paired region. This feature is available for the options below: Create a VM, Restore Disks. We don’t currently support the Replace existing disks option. |
Restore an encrypted virtual machine
Azure Backup supports the backup and restore of machines encrypted through Azure Disk Encryption. Disk Encryption works with Azure Key Vault to manage the relevant secrets that are associated with the encrypted disk. For an additional layer of security, you can use key vault encryption keys (KEKs) to encrypt the secrets before they’re written to the key vault. Certain limitations apply when you restore encrypted virtual machines:
- Azure Backup supports only standalone key encryption. Any key that’s part of a certificate isn’t supported currently.
- File-level or folder-level restores are not supported with encrypted virtual machines. To restore to that level of granularity, the whole virtual machine has to be restored. You can then manually copy the file or folders.
- The Replace existing VM option isn’t available for encrypted virtual machines.
Protect your Azure infrastructure with Azure Site Recovery – Learn | Microsoft Docs
Azure Site Recovery
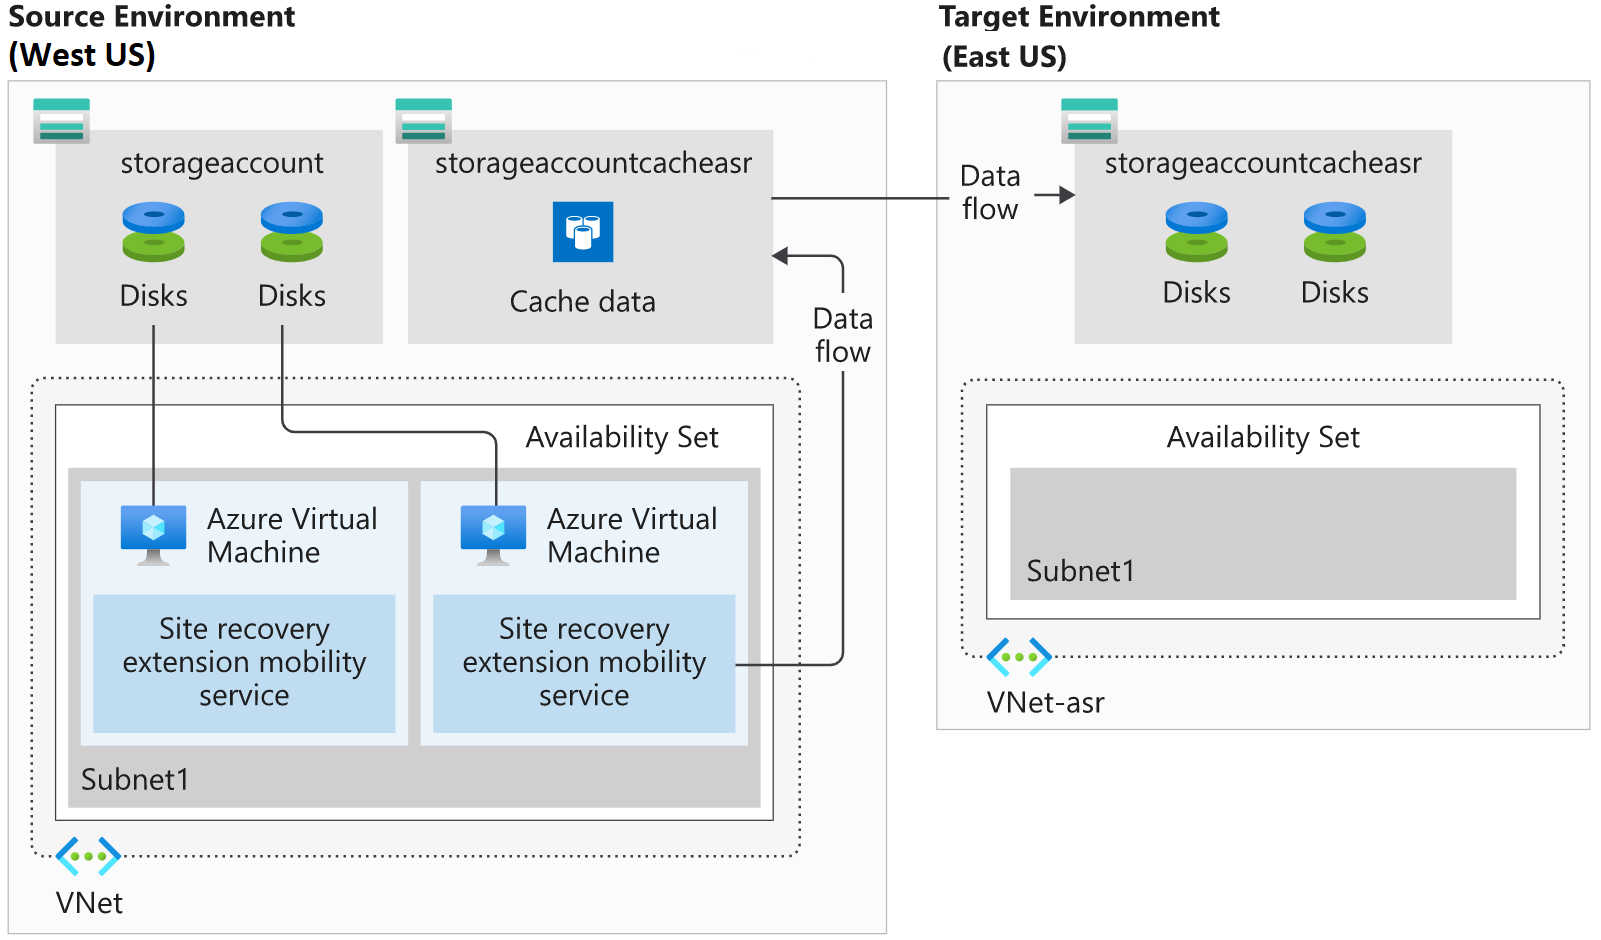
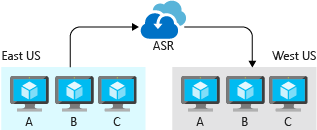
Azure Site Recovery replicates your virtual machine workloads between Azure regions. You can also use Site Recovery to migrate VMs from other environments, such as on-premises infrastructure, to Azure. Site Recovery manages the orchestration of disaster recovery in Azure. It’s designed to replicate workloads from a primary site or region, to a secondary site. If the primary site has an issue, Site Recovery can replicate protected VMs to another Azure region. Site Recovery manages the replication of Azure VMs between regions, or the replication of on-premises VMs to Azure and back again. Because it’s built natively into Azure, Site Recovery can run seamless tests (disaster recovery drills) without affecting production workloads. Site Recovery protects your VM instances in Azure automatically. Site Recovery mirrors the source VM configuration and creates required or associated resource groups, storage accounts, virtual networks, and availability sets to a secondary Azure region. The resources created are appended with a Site Recovery suffix.
Snapshots & Recovery Points
Site Recovery has customizable replication policies that allow you to define the retention history of recovery points and the frequency of snapshots. You create a recovery point from a snapshot of a VMs’ disk. The two types of snapshots available are App-consistent and Crash-consistent.
- App-consistent recovery captures the same data as crash-consistent but also includes all in-memory data and in-process transactions. Including the in-memory data means Site Recovery can restore a VM and any running apps without any data loss. The default for capturing snapshots is every 60 minutes.
- Crash-consistent recovery represents the data on-disk at the time the snapshot is taken. The default for capturing snapshots is every five minutes.
All recovery points are kept for 24 hours by default, although you can extend this period to 72 hours.
Replication to a secondary region
Installing the Site Recovery mobility service happens when you enable replication for an Azure VM. The installed extension registers the VM with Site Recovery. Continuous replication of the VM then begins, with any writes to the disk immediately transferred to a local storage account. Site Recovery uses this account, replicating the cache to a storage account in the destination environment. Site Recovery copies data stored in the cache and syncs it with either the target storage account or replicated managed disks. After the data is processed, crash-consistent recovery points are created. If app-consistent recovery points are enabled, they’ll be generated on a schedule as set in the Site Recovery replication policy. Site Recovery can use accelerated networking for Azure VMs, reducing jitter and CPU usage.
Disaster recovery (DR) drills
Site Recovery enables you to do disaster recovery drills after all the prerequisite configuration tasks are complete. Running a DR drill enables you to validate the replication strategy for your environment without losing data, having downtime, or compromising your production environment. Drills don’t affect your production environment and are a way to test that you have correctly configured everything. Site Recovery failover and failback can be quickly started using the Azure portal. When running a failover, you select a recovery point, then let Site Recovery take care of the failover. Failback is simply a reverse of this process. When a failover is successfully committed, it’s available to failback.
Disaster recovery preparation with Azure Site Recovery
1 2 3 4 5 6 7 8 9 10 11 12 13 14 15 | # Create company infrastructurecurl https://raw.githubusercontent.com/MicrosoftDocs/mslearn-protect-infrastructure-with-azure-site-recovery/master/deploy.json > deploy.jsonaz group create --name east-coast-rg --location eastus2az group create --name west-coast-rg --location westus2az deployment group create \ --name asrDeployment \ --template-file deploy.json \ --parameters storageAccounts_asrcache_name=asrcache$RANDOM \ --resource-group west-coast-rg# Add a Recovery Services vault# Organize target resources# Configure outbound network connectivity# Set up replication on existing VMs |
What is a Recovery Services vault?
A Recovery Services vault enables Site Recovery to complete disaster recovery replication. These vaults use storage accounts to store data backups, VM configuration settings, and workloads. To meet Site Recovery requirements, provision a recovery services vault using the portal or the Azure CLI.
Site Recovery Requirments
The target resources for Site Recovery replication have to be in a different Azure region. The storage account that stores the backed-up data must also be in a different region to the resources being protected. The target region allows the creation of VMs, and has enough resources to match the size of the existing VMs. Site Recovery requires outbound connectivity on the VMs that you want to replicate. The required network connectivity is set up for you automatically when using VMs created in Azure. However, when you migrate on-premises VMs to Azure, you may need to update your network connectivity. Every Azure VM you want to replicate has to register with Site Recovery. For a VM to register, Site Recovery requires the latest root certificates installed on the VM. On a Windows VM, you’ll need to make sure to install all the latest Windows updates. The process for updating root certificates on Linux VMs varies from distribution to distribution. Azure Mobility Service needs to be installed on every VM that you replicate. This client is available for Windows and Linux VMs and will be installed and configured automatically by Site Recovery. If the automatic installation fails, you can install the service manually. The mobility service works in partnership with Site Recovery to keep an up-to-date cache of the VMs’ data. The cache is replicated to the target environment’s storage account. The replicated data will be used if Site Recovery fails over the environment.
Set up disaster recovery with Azure Site Recovery
Azure Site Recovery automates the setup of recovery from one region to another. The setup process will install the Mobility Service on to the VMs, create the required infrastructure in the recovery region, and give you a way to monitor the progress. Currently, two virtual machines are running the company’s patient and employee systems. These systems are running in the West US region. You’ve been asked to protect the infrastructure by enabling it to be recovered to the East US region. Using Azure Site Recovery, you’ll enable a Recovery Services vault to replicate the current workloads.

Create a recovery services vault
- Select + Create a resource option on the top-left hand side of the portal.
- Under the Azure Marketplace, select IT & Management Tools, then select Backup and Site Recovery.
- Select east-coast-rg for the Resource Group.
- Set the Vault name to asr-vault.
- Set the Region to East US 2.
- Select. Review + create, and then on the Summary page, select Create.
What is a disaster recovery drill?
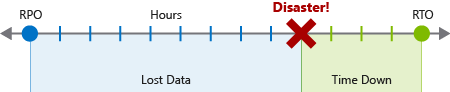
A DR drill is a way to check if you configured your solution correctly. The drill should give you, and your company, confidence that your data and services are available even if a disaster happens. Typically, organizations set a recovery time objective (RTO) that indicates how long it will take to recover infrastructure. Alongside the RTO, your company should define a recovery point objective (RPO). The RPO defines the amount of data loss that is acceptable as a function of time. For example, if your company’s RPO is a day, you’ll need to create at least a backup of all your data each day. You’ll also need to make sure it takes less than a day to restore this backup.
A DR drill is vital to ensure the solution implemented meets the business continuity and disaster recovery (BCDR) requirements, and to check the replication works appropriately. Your DR drill, combined with RTO and RPO, needs to be tested thoroughly to ensure replication, failover, and recovery occur in the required timeframe.
For example, assume your RTO is an hour, and RPO is six hours. If your systems are backed up every hour, that’s an hour of lost data plus the additional hour to recover your systems.
Imagine your actual recovery time is five hours. Your systems are now close to being over six hours out of date, which means you’ll be in breach of the BCDR RPO objective. Testing the actual time it takes to recover from failures can give you confidence that your systems follow your BCDR plans.
Difference between a drill and production failover
Running a production failover in Site Recovery is similar to that of a test drill. There are some exceptions, the first being that Failover is selected, instead of Test failover. You can choose to shut down the source VM before starting the failover so that no data is lost during the switch. Site Recovery doesn’t clean up the source environment after the failover is complete.
When the failover is completed, validate the VM is working as expected. Site Recovery enables you to change the recovery point at this stage. If you’re satisfied that the failover works, you’ll Commit the failover. Site Recovery deletes all the source VM recovery points, and completes the failover. With your replicated infrastructure and data in the secondary region, you must remember that the new VM in the secondary region also needs protection.
Failover and failback using Azure Site Recovery
A failover occurs when a decision is made to execute a DR plan for your organization. The existing production environment, protected by Site Recovery, is replicated to a different region. The target environment becomes the de facto production environment and becomes the environment your organization’s production services run on. After the target region is active, the source environment should no longer be used. You’ll enforce this condition by leaving the source VMs stopped. There’s another advantage to shutting down the source VMs. Using a shut-down VM results in minimal data loss, as Site Recovery waits until all the data is written to disk before triggering the failover. To use this data and have the lowest possible RPO, we select the Latest (lowest RPO) recovery point.
Failback is the reverse of a failover. It’s where a completed failover to a secondary region has been committed, and is now the production environment. Reprotection has completed for the failed-over environment, and the source environment is now its replica. In a failback scenario, Site Recovery will fail over back to the source VMs.
The process to complete a failback is the same as a failover, even down to reusing the recovery plan. Selecting failover on your recovery plan has from set to the target region, and the to set to the source region.
Site Recovery can run failovers on demand. Test failovers are isolated, meaning they don’t impact production services. This flexibility enables you to run a failover without interrupting the users of that system. The flexibility works the other way too, allowing failback on-demand either as part of a planned test or as part of a fully-invoked DR process.
What is reprotection, and why is it important?
When a VM is failed over, the replication performed by Site Recovery is no longer occurring. You have to re-enable the protection to start protecting the failed-over VM. As you already have the infrastructure in a different region, you can start replication back to the source region. Reprotection enables Site Recovery to start replicating your new target environment back to the source environment where it started.
The flexibility of failing over single VMs, or failing over using a recovery plan, can be used to reprotect your failed-over infrastructure. You can reprotect each VM individually, or you can reprotect multiple VMs using a recovery plan.
Reprotecting takes anywhere between 45 minutes to 2 hours, depending on the size and type of VM. Unlike the other Site Recovery processes that can be monitored by watching the progress of the jobs, you must view reprotection progress at the VM level. This requirement is because the synchronization phase isn’t listed as a site recovery job.
Fail over a VM to a secondary region using PowerShell
1 2 3 4 5 6 7 8 9 10 11 12 13 14 15 16 17 18 19 20 21 22 23 24 25 26 27 28 29 30 31 32 33 34 | # Store the Azure Site Recovery vault in a variable.$vault = Get-AzRecoveryServicesVault -Name "asr-vault"# Set the context for the session to your vault.# Store the protected patient records from the vault.# Get a list of all the recovery points.# Trigger a failover for the latest recovery point.# Show the result of the failover.Set-AzRecoveryServicesAsrVaultContext -Vault $vault $PrimaryFabric = Get-AsrFabric -Name "asr-a2a-default-westus2" $PrimaryProtContainer = Get-ASRProtectionContainer -Fabric $PrimaryFabric $ReplicationProtectedItem = Get-ASRReplicationProtectedItem -ProtectionContainer $PrimaryProtContainer -FriendlyName "patient-records" $RecoveryPoints = Get-ASRRecoveryPoint -ReplicationProtectedItem $ReplicationProtectedItem $Job_Failover = Start-ASRUnplannedFailoverJob -ReplicationProtectedItem $ReplicationProtectedItem -Direction PrimaryToRecovery -RecoveryPoint $RecoveryPoints[-1] do { $Job_Failover = Get-ASRJob -Job $Job_Failover; sleep 30; } while (($Job_Failover.State -eq "InProgress") -or ($JobFailover.State -eq "NotStarted")) $Job_Failover.State $CommitFailoverJob = Start-ASRCommitFailoverJob -ReplicationProtectedItem $ReplicationProtectedItem Get-ASRJob -Job $CommitFailoverJob# Reprotect the VM# Set up variables that will be used by the Update-AzRecoveryServicesAsrProtectionDirection command.# Require a storage account to store the reprotected logs and data. This storage needs to be in the same region as the VM that is being protected.# Start the reprotect job using the last line, and store a reference to it.$RecoveryFabric = Get-AsrFabric -Name "asr-a2a-default-eastus2"$RecoveryProtContainer = Get-ASRProtectionContainer -Fabric $RecoveryFabric$ProtectionContainerMapping = Get-AzRecoveryServicesAsrProtectionContainerMapping -ProtectionContainer $RecoveryProtContainer -Name eastus2-westus2-24-hour-retention-policy$StorageAccount = New-AzStorageAccount -ResourceGroupName "east-coast-rg" -AccountName "reprotectcache$(Get-Random)" -Location eastus2 -SkuName Standard_GRS$ResourceGroup = Get-AzResourceGroup -Name "west-coast-rg"$ReprotectJob = Update-AzRecoveryServicesAsrProtectionDirection -AzureToAzure -ProtectionContainerMapping $ProtectionContainerMapping -ReplicationProtectedItem $ReplicationProtectedItem -LogStorageAccountId $StorageAccount.ID -RecoveryResourceGroupId $ResourceGroup.ResourceId |
Microsoft Azure Well-Architected Framework – Reliability – Learn | Microsoft Docs
Evaluate high availability for your architecture
There are three steps to evaluate an application for high availability:
- Determine the service-level agreement of your application: A service-level agreement (SLA) is an agreement between a service provider and a service consumer in which the service provider commits to a standard of service based on measurable metrics and defined responsibilities. SLAs can be strict, legally bound, contractual agreements, or assumed expectations of availability by customers. Service metrics typically focus on service throughput, capacity, and availability, all of which can be measured in various ways. Regardless of the specific metrics that make up the SLA, failure to meet the SLA can have serious financial ramifications for the service provider. A common component of service agreements is guaranteed financial reimbursement for missed SLAs. Service-level objectives (SLO) are the values of target metrics that are used to measure performance, reliability, or availability. These could be metrics defining the performance of request processing in milliseconds, the availability of services in minutes per month, or the number of requests processed per hour. By evaluating the metrics exposed by your application and understanding what customers use as a measure of quality, you can define the acceptable and unacceptable ranges for these SLOs. By defining these objectives, you clearly set goals and expectations with both the teams supporting the services and customers who are consuming these services. These SLOs will be used to determine if your overall SLA is being met.
- Evaluate the HA capabilities of the application: To evaluate the HA capabilities of your application, perform a failure analysis. Focus on single points of failure and critical components that would have a large impact on the application if they were unreachable, misconfigured, or started behaving unexpectedly. For areas that do have redundancy, determine whether the application is capable of detecting error conditions and self-healing.
- Evaluate the HA capabilities of dependent applications: You’ll need to understand not only your application’s SLA requirements to your consumer, but also the provided SLAs of any resource that your application may depend on. If you are committing an uptime to your customers of 99.9%, but a service your application depends on only has an uptime commitment of 99%, this could put you at risk of not meeting your SLA to your customers.
There are several core concepts when considering HA for your architecture on Azure:
- Availability sets
- Availability zones
- Load balancing
- Platform as a service (PaaS) HA capabilities
Availability sets
Availability sets are a way for you to inform Azure that VMs that belong to the same application workload should be distributed to prevent simultaneous impact from hardware failure and scheduled maintenance. Availability sets are made up of update domains and fault domains.
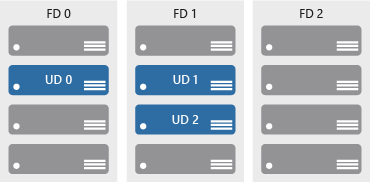
Update domains ensure that a subset of your application’s servers always remain running when the virtual machine hosts in an Azure datacenter require downtime for maintenance. Most updates can be performed with no impact to the VMs running on them, but there are times when this isn’t possible. To ensure that updates don’t happen to a whole datacenter at once, the Azure datacenter is logically sectioned into update domains (UD). When a maintenance event, such as a performance update and critical security patch that needs to be applied to the host, the update is sequenced through update domains. The use of sequencing updates using update domains ensures that the whole datacenter isn’t unavailable during platform updates and patching.
While update domains represent a logical section of the datacenter, fault domains (FD) represent physical sections of the datacenter and ensure rack diversity of servers in an availability set. Fault domains align to the physical separation of shared hardware in the datacenter. This includes power, cooling, and network hardware that supports the physical servers located in server racks. In the event the hardware that supports a server rack has become unavailable, only that rack of servers would be affected by the outage. By placing your VMs in an availability set, your VMs will be automatically spread across multiple FDs so that in the event of a hardware failure only part of your VMs will be impacted.
Availability zones
Availability zones are independent physical datacenter locations within a region that include their own power, cooling, and networking. By taking availability zones into account when deploying resources, you can protect workloads from datacenter outages while retaining presence in a particular region. Services like virtual machines are zonal services and allow you to deploy them to specific zones within a region. Other services are zone-redundant services and will replicate across the availability zones in the specific Azure region. Both types ensure that within an Azure region there are no single points of failure.
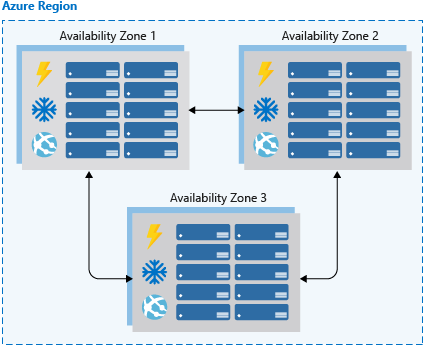
Supported regions contain a minimum of three availability zones. When creating zonal service resources in those regions, you’ll have the ability to select the zone in which the resource should be created. This will allow you to design your application to withstand a zonal outage and continue to operate in an Azure region before having to evacuate your application to another Azure region.
Availability zones are mutually exclusive with availability sets. When using availability zones, you no longer need to define an availability set for your systems. You’ll have diversity at the data center level, and updates will never be performed to multiple availability zones at the same time.
Load balancing
Load balancers manage how network traffic is distributed across an application. Load balancers are essential in keeping your application resilient to individual component failures and to ensure your application is available to process requests. For applications that don’t have service discovery built in, load balancing is required for both availability sets and availability zones.
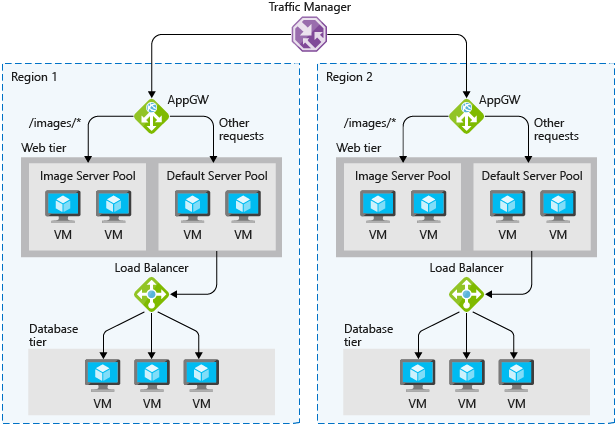
Azure possesses three load balancing technology services that are distinct in their abilities to route network traffic:
- Azure Traffic Manager provides global DNS load balancing. You would consider using Traffic Manager to provide load balancing of DNS endpoints within or across Azure regions. Traffic manager will distribute requests to available endpoints, and use endpoint monitoring to detect and remove failed endpoints from load.
- Azure Application Gateway provides Layer 7 load-balancing capabilities, such as round-robin distribution of incoming traffic, cookie-based session affinity, URL path-based routing, and the ability to host multiple websites behind a single application gateway. Application Gateway by default monitors the health of all resources in its back-end pool and automatically removes any resource considered unhealthy from the pool. Application Gateway continues to monitor the unhealthy instances and adds them back to the healthy back-end pool once they become available and respond to health probes.
- Azure Load Balancer is a layer 4 load balancer. You can configure public and internal load-balanced endpoints and define rules to map inbound connections to back-end pool destinations by using TCP and HTTP health-probing options to manage service availability.
PaaS HA capabilities
PaaS services come with high availability built in. Services such as Azure SQL Database, Azure App Service, and Azure Service Bus include high availability features and ensure that failures of an individual component of the service will be seamless to your application. Using PaaS services is one of the best ways to ensure that your architecture is highly available.
Recovery objectives
A complete plan needs to specify two critical business requirements for each process implemented by the application:
- Recovery Point Objective (RPO): The maximum duration of acceptable data loss. RPO is measured in units of time, not volume: “30 minutes of data”, “four hours of data”, and so on. RPO is about limiting and recovering from data loss, not data theft.
- Recovery Time Objective (RTO): The maximum duration of acceptable downtime, where “downtime” needs to be defined by your specification. For example, if the acceptable downtime duration is eight hours in the event of a disaster, then your RTO is eight hours.
Designing for disaster recovery has two main concerns:
- Data recovery: Using backups and replication to restore lost data.
- Process recovery: Recovering services and deploying code to recover from outages.
Data recovery and replication
Replication duplicates stored data between multiple data store replicas. Unlike backup, which creates long-lived, read-only snapshots of data for use in recovery, replication creates real-time or near-real-time copies of live data. The goal of replication is to keep replicas synchronized with as little latency as possible while maintaining application responsiveness. Replication is a key component of designing for high availability and disaster recovery, and is a common feature of production-grade applications.
Replication is used to mitigate a failed or unreachable data store by executing a failover: changing application configuration to route data requests to a working replica. Failover is often automated, triggered by error detection built into a data storage product, or detection that you implement through your monitoring solution. Depending on the implementation and the scenario, failover may need to be manually executed by system operators.
Different Azure services support various levels and concepts of replication. For example:
- Azure Storage replication capabilities depend on the type of replication that is selected for the storage account. This replication can be local (within a datacenter), zonal (between data centers within a region), or regional (between regions). Neither your application nor your operators interact with it directly. Failovers are automatic and transparent, and you simply need to select a replication level that balances cost and risk.
- Azure SQL Database replication is automatic at a small scale, but recovery from a full Azure datacenter or regional outage requires geo-replication. Setting up geo-replication is manual, but it’s a first-class feature of the service and well supported by documentation.
- Azure Cosmos DB is a globally distributed database system, and replication is central to its implementation. With Azure Cosmos DB you configure options related to regions associated with your database, data partitioning, and data consistency.
Many different replication designs exist that place different priorities on data consistency, performance, and cost. Active replication requires updates to take place on multiple replicas simultaneously, guaranteeing consistency at the cost of throughput. In contrast, passive replication performs synchronization in the background, removing replication as a constraint on application performance, but increasing RPO. Active-active or multi-master replication enables multiple replicas to be used simultaneously, enabling load balancing at the cost of complicating data consistency, while active-passive replication reserves replicas for live use only during failover.

Neither replication nor backup are complete disaster recovery solutions on their own. Data recovery is only one component of disaster recovery, and replication will not fully satisfy many kinds of disaster recovery scenarios. For example, in a data corruption scenario, the nature of the corruption may allow it to spread from the primary data store to the replicas, rendering all the replicas useless and requiring a backup for recovery.
Azure Site Recovery
Azure Site Recovery is a service that’s dedicated to managing process recovery for workloads running on VMs deployed to Azure, VMs running on physical servers, and workloads running directly on physical servers. Site Recovery replicates workloads to alternate locations and helps you to failover when an outage occurs and supports testing of a disaster recovery plan.
Site Recovery supports replicating whole VMs and physical server images as well as individual workloads, where a workload may be an individual application or an entire VM or operating system with its applications. Any application workload can be replicated, but Site Recovery has first-class integrated support for many Microsoft server applications, such as SQL Server and SharePoint, as well as a handful of third-party applications like SAP.
Don’t confuse archival, replication, and backup. Archival is the storage of data for long-term preservation and read access. Replication is the near-real-time copying of data between replicas to support high availability and certain disaster recovery scenarios. Some requirements, such as data retention laws, may influence your strategies for all three of these concerns. Archival, replication, and backup all require separate analysis and implementation.
Azure Backup
Azure Backup is a family of backup products that back up data to Azure Recovery Services vaults for storage and recovery. Recovery Service vaults are storage resources in Azure that are dedicated to holding data and configuration backups for virtual machines, servers, and individual workstations and workloads.
Azure Backup serves as a general-purpose backup solution for cloud and on-premises workflows that run on VMs or physical servers. It’s designed to be a drop-in replacement for traditional backup solutions that stores data in Azure instead of archive tapes or other local physical media.
Four different products and services can use Azure Backup to create backups:
- Azure Backup Agent is a small Windows application that backs up files, folders, and system state from the Windows VM or server on which it’s installed. It works in a way that’s similar to many consumer cloud-based backup solutions, but requires configuration of an Azure Recovery vault. Once you download and install it onto a Windows server or VM, you can configure it to create backups up to three times a day.
- System Center Data Protection Manager is a robust, fully featured, enterprise-level backup and recovery system. Data Protection Manager is a Windows Server application that can back up filesystems and virtual machines (Windows and Linux), create bare-metal backups of physical servers, and perform application-aware backup of many Microsoft server products, such as SQL Server and Exchange. Data Protection Manager is part of the System Center family of products and is licensed and sold with System Center, but it’s considered part of the Azure Backup family because it can store backups in an Azure Recovery vault.
- Azure Backup Server is similar to Data Protection Manager, but it’s licensed as part of an Azure subscription and doesn’t require a System Center license. Azure Backup Server supports the same functionality as Data Protection Manager except for local tape backup and integration with the other System Center products.
- Azure IaaS VM Backup is a turnkey backup and restore feature of Azure Virtual Machines. VM backup supports once-per-day backups for Windows and Linux virtual machines. It supports recovery of individual files, full disks, and entire VMs, and can also perform application-consistent backups. Individual applications can be made aware of backup operations and get their filesystem resources into a consistent state before the snapshot is taken.
Azure Blob storage
Azure Storage doesn’t include an automated backup feature, but blobs are commonly used to back up all kinds of data from various sources. Many services that provide backup capabilities use blobs to store their data, and blobs are a common target for scripts and tools in every kind of backup scenario.
General Purpose v2 storage accounts support three different blob storage tiers of varying performance and cost. Cool storage offers the best cost-to-performance ratio for most backups, as opposed to hot storage, which offers lower access costs but higher storage costs. Archive-tier storage may be appropriate for secondary backups or backups of data with low expectations for recovery time. It’s low in cost, but requires up to 15 hours of lead time to access.
Immutable blob storage is configurable to be non-erasable and non-modifiable for a user-specified interval. Immutable blob storage was designed primarily to fulfill strict requirements for certain kinds of data, such as financial data. It’s a great option for ensuring that backups are protected against accidental deletion or modification.
Azure SQL Database
Comprehensive, automatic backup functionality is included with Azure SQL Database at no extra charge. Full backups are created weekly, with differential backups performed every 12 hours, and log backups created every five minutes. Backups created by the service can be used to restore a database to a specific point in time, even if it’s been deleted. Restores can be performed using the Azure portal, PowerShell, or the REST API. Backups for databases encrypted with Transparent Data Encryption, enabled by default, are also encrypted. SQL Database backup is enterprise-grade, production ready, and enabled by default. If you’re evaluating different database options for an app, it should be included as part of cost-benefit analysis, as it’s a significant benefit of the service. Every app that uses Azure SQL Database should take advantage of it by including it in their disaster recovery plan and backup/restore procedures.
Questions
- Why would you use Azure Security Center?
- You want to secure an infrastructure that consists of on-premises and cloud resources.
- You want to secure an infrastructure that consists of only cloud resources.
- You want to secure an infrastructure that consists of only on-premises resources.
- How can you prevent persistent access to your virtual machines by using Azure Security Center?
- Use playbooks to block access.
- Use just-in-time access to prevent persistent access.
- Use automation and orchestration to block access.
- Which tool allows you to automate your responses to alerts?
- Use just-in-time access to automate your response to alerts.
- Use playbooks to automate your response to alerts.
- Use adaptive controls to automate your response to alerts.
- Why would you use Azure Application Insights?
- You want to analyze and address problems that affect your cloud infrastructure’s security.
- You want to analyze and address problems that affect your on-premises infrastructure’s security.
- You want to analyze and address problems that affect your application’s health.
- How can you continuously monitor your applications from different geographic locations?
- Use availability tests to continuously monitor your application from different geographic locations.
- Use an instrumentation key to continuously monitor your application from different geographic locations.
- Use Log Analytics to continuously monitor your application from different geographic locations.
- How would you continuously monitor your release pipelines?
- Use availability tests to monitor your release pipelines.
- Use a continuous monitoring gate to monitor release pipelines.
- Use the application map to monitor your release pipelines.
- Why would you use Azure Sentinel?
- You want to improve the development lifecycle for an application that spans across on-premises and the cloud.
- You want a detailed overview of your enterprise, potentially across multiple clouds and on-premises locations.
- You want to be able to cross-query over data collected from multiple sources that span on-premises and the cloud.
- How do you set up Azure Sentinel on Azure?
- Create an Azure Sentinel instance, and then add Azure Sentinel to a workspace.
- Connect your data source, create a workspace, and then add Azure Sentinel to that workspace.
- Create a workspace, and then add that workspace to Azure Sentinel.
- Sentinel has raised an incident. How can you investigate which users have been affected?
- Use the investigation map, drill down into the incident, and look for data sources.
- Use the investigation map, drill down into the incident, and look for user entities affected by the alert.
- Use the investigation map, drill down into the incident, and look for playbooks.
- You need to write queries to analyze your log data. How would you do this?
- Use the Log Analytics agent to write your queries.
- Use Log Analytics to write your queries.
- Use a workspace to write your queries.
- How can you automatically collect security-related data from all newly created virtual machines into one central location?
- Use the Log Analytics agent.
- Use an instance of Application Insights.
- Use a cross-resource query.
- How can you analyze both security-related data and application performance data together?
- Use the Log Analytics agent to query Azure Security Center and Application Insights workspaces together.
- Use a cross-resource query to query Azure Security Center and Application Insights workspaces together.
- Use automatic provisioning to query Azure Security Center and Application Insights workspaces together.
- You want to track the average CPU usage of your Azure virtual machine over the last seven days. What is the most straightforward way to do this?
- View the metrics for the virtual machine on the Overview page and set the range to the last seven days.
- View the metrics for the virtual machine each day and store the values for each of the last seven days in a spreadsheet.
- View the metric in the Monitor section by creating a graph and set the range to the last seven days.
- What do you have to install or create to store simple boot diagnostics in Azure?
- Install the Azure Diagnostics extension.
- You don’t have to install or create anything additional to store diagnostic logs in Azure.
- An Azure storage account.
- What data does Azure Monitor collect?
- Data from a variety of sources, such as the application event log, the operating system (Windows and Linux), Azure resources, and custom data sources
- Azure billing details
- Backups of database transaction logs
- What two fundamental types of data does Azure Monitor collect?
- Metrics and logs
- Username and password
- Email notifications and errors
- You start out by talking to individual business units about monitoring wants and needs at the start of your assignment. You determine each business unit only needs to query logs generated from their resources. Which access model would you select for your Log Analytics deployment?
- Workspace-context
- Resource-context
- Table level RBAC
- What does Azure Monitor for VMs provide?
- Provides insight into operations performed on Azure resources.
- Provides access to create, read, update, delete (CRUD) events.
- Provides access to log data without exposing the user to underlying queries.
- How does Azure Monitor organize log data for queries?
- Azure Monitor organizes log data into tables.
- Azure Monitor organizes log data into tabular operators.
- Azure Monitor organizes log data into the Kusto Query Language.
- What is the schema?
- Azure Data Explorer
- A series of tables logically grouped together which allow for an easy understanding behind how Log Analytics stores logs.
- Metrics
- What’s the composition of an alert rule?
- Resource, condition, log, alert type
- Metrics, logs, application, operating system
- Resource, condition, actions, alert details
- Which of the following is an example of a log data type?
- Percentage of CPU over time.
- HTTP response records.
- Database tables.
- Website requests per hour.
- How are smart groups created?
- Through a template deployment.
- Through the Azure CLI.
- Automatically, using machine learning algorithms.
- Which of the following is NOT a state of a smart group alert?
- Failed
- New
- Acknowledged
- Closed
- What types of Web apps can save logs to Azure Blob storage?
- Node.js apps on Windows.
- Node.js apps on Linux.
- ASP.NET Core apps on Linux.
- Why is file system logging automatically turned off after 12 hours?
- To optimize app performance.
- So that storage space can be reused.
- To enable Web apps to reinstantiate on different server instances, with different file system storage.
- You want to make sure that admins know as soon as a web app becomes overloaded. Which feature of Application Insights should you use?
- Alerts
- Live metrics streams
- Usage Analysis
- You have a Linux-based web app that runs in the Azure App Service. You want to display basic performance data in an Application Insights dashboard. Which method should you use to instrument your app?
- Runtime instrumentation
- Automatic client-side telemetry
- Build-time instrumentation
- You’ve enabled Application Insights for your web app. In which of the following Azure resources will telemetry data be stored for the app?
- In the web app.
- In the Application Insights resource.
- In the Application Insights dashboard.
- You create a custom chart and pin it to an Application Insights dashboard. Other users of the dashboard can’t see the new chart. What should you do to resolve the problem?
- Re-publish the Application Insights dashboard.
- Make sure you’ve specified a filter in the chart.
- Choose a different aggregation method in the chart.
- Which restore type should you select if you want to replace a disk on an existing virtual machine?
- Create a new VM
- Restore disk
- Replace existing
- You want to replace a disk on an existing VM but receive an error. What’s the possible reason?
- The existing VM has been deleted and is no longer available
- The existing VM is part of a different resource group in your Azure subscription
- The existing VM is turned off
- How are storage accounts used by Site Recovery to store data backups?
- Site Recovery creates recovery services vaults.
- Site Recovery creates docker containers using storage accounts.
- Site Recovery creates and stores managed disks.
- Which four ways does Site Recovery protect virtual machine infrastructure?
- Implements an organization’s BCDR, enables automatic failover and recovery, automatically protects failed-over machines, and automatically manages backup storage.
- Creates snapshots and recovery points, replicates VMs to a secondary region, supports DR drills, and enables flexible failover/failback.
- Backs up VM disks locally and to a different region, automatically manages backup storage, creates a Microsoft Azure Backup Server (MABS), and mirrors workloads between primary and secondary regions
- How does Site Recovery support grouping of machines and workloads?
- Site Recovery Mobility service.
- Recovery plans.
- Azure Automation.
- An SLA is important to define for your service because:
- It helps you determine your backup retention requirements.
- It helps you determine the availability of your service that you will commit to for your customers.
- You can use it to convince your manager to automate virtual-machine creation.
- You use it to define the access control settings for your resources.
- Which of the following is not used in a highly available architecture?
- Load balancing
- Availability zones
- Availability sets
- A recovery service vault
- Which of the following can be excluded from your recovery steps in your recovery plan?
- How to restore backups
- How to fail over to replicated systems
- How to reestablish network connectivity to on-premises or external networks
- None of the above should be excluded in a recovery plan.
- True or false: data replication and data backup are the same thing.
- True
- False
- True or false: all Azure data storage options include automatic backup of data?
- True
- False
- Why is it important to test restores regularly?
- To validate the integrity of your backups.
- To become familiar with the restoration process.
- To identify gaps in your backup and restore processes.
- All of the above.
Answers
- a. Azure Security Center helps you secure your on-premises and cloud resources.
- b. With just-in-time access, your virtual machines are only accessed based on rules that you configure.
- b. Playbooks are automated procedures that you can run against alerts.
- c. You can analyze and address issues such as exceptions, failures, and availability problems.
- a. Availability tests let you monitor your application from multiple locations in the world.
- b. Use the gate to stop deployment when an issue has been identified. Deployment will continue automatically when the issue is resolved.
- b. Azure Sentinel will help monitor and respond to security threats across your entire enterprise.
- C. You’ll need to create a Log Analytics workspace.
- B. Use entities to view users that might have been in the path of a particular threat or malicious activity.
- b. You can create and run queries on your logs and view results with Log Analytics.
- a. The agent gathers security-related information from resources into a workspace.
- b. You use cross-resource querying to analyze the log data collected from separate workspaces.
- a. The Overview page displays this graph by default. You can set the range to show a seven-day range.
- b. You need a storage account to store boot diagnostics data, the boot screenshots, and logs.
- a. This answer is correct.
- a. Azure Monitor collects two types of data: metrics and logs. Metrics are numerical values that describe some aspect of a system at a particular time. Logs contain different kinds of data, such as event information, organized into records.
- b. Provides access to view logs for resources in all tables you have access to. Queries are scoped to only data associated with that resource.
- c. Allows deeper performance analysis of a virtual machine without query building.
- a. Azure Monitor organizes log data in tables, each composed of multiple columns. Every query contains data that’s organized into a hierarchy similar to SQL (databases, tables, and columns).
- b. The schema provides a simple way to understand data organization in Log Analytics.
- c. These elements make up an alert rule.
- b. HTTP response records are examples of log data types.
- c.
- a. Failed is not a smart group alert state.
- a. Any app that runs on Windows can save logs to Blob storage.
- a. Excessive logging can potentially cause app performance to degrade.
- A. You can create an alert that triggers when a condition is satisfied – for example, when the web app is overloaded. When the alert triggers, you can configure it to send an email, for example, to inform admins. Usage Analysis will show past periods of heavy web app utilization, but only when admins review it. To ensure admins know about overloads as soon as the app is overloaded, use an alert. Live metrics streams will show whether a web app is overloaded but only when admins are looking at them. To ensure admins know about overloads as soon as the app is overloaded, use an alert.
- C. Because your app is based on Linux, you need to use build-time instrumentation. Runtime instrumentation and automatic client-side telemetry are available only for Windows apps. Live metrics streams will show whether a web app is overloaded but only when admins are looking at them. To ensure admins know about overloads as soon as the app is overloaded, use an alert. Usage Analysis will show past periods of heavy web app utilization, but only when admins review it. To ensure admins know about overloads as soon as the app is overloaded, use an alert.
- b. The web app sends its telemetry data to the Application Insights resource, where it’s stored for analysis.
- a. When you make changes to a dashboard in Azure, other dashboard users won’t see the changes until you publish them.
- c. Selecting this option allows for a disk to be restored and then used to replace a disk on an existing VM. Restore disk is for replacing a VM disk
- a. If the VM was deleted, the disk can’t be restored. Option b is irrelevant because it is used to create a new VM
- a. Recovery services vaults are used to store backup data, VM configuration settings, and workloads.
- b. These are the four main features of Site Recovery that will protect your VMs.
- b. Recovery plans enable you to group VMs around workloads. For example, a recovery plan protecting a company’s e-commerce website would include the web server, database server, and API server. The mobility service is installed on VMS automatically by Site Recovery. It doesn’t group machines together.
- b. Service level agreement is a commitment you are making to your customers for the availability of your service.
- d. Recovery service vaults provide a destination for backups, but they are not part of a highly available architecture.
- d. All these procedures are necessary in a recovery plan.
- b. Replication creates real-time or near-real-time copies of live data for use in failover during execution. Backup creates long-lived, read-only snapshots of data for use in recovery,
- b. Most Azure services offer integrated backup functionality, but it is not always enabled by default. You can also add services like Azure Backup Agent as needed to make sure all your data is protected.
- d. All are benefits of regularly testing your restore process.
No comments:
Post a Comment